Explore spinning tops in candlestick patterns to understand market indecision and potential trend reversals or continuations.
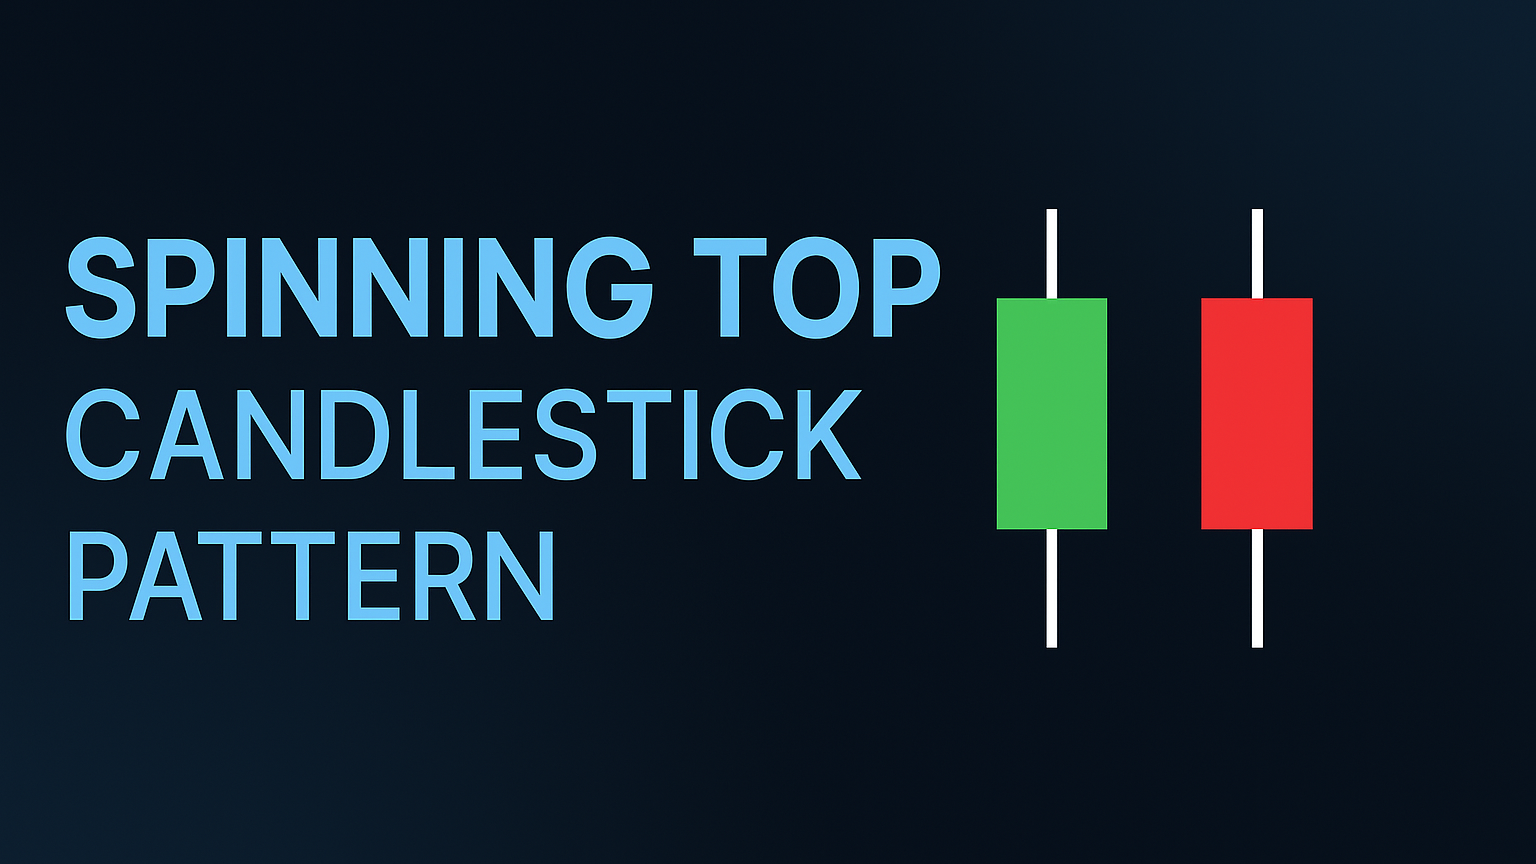
Spinning tops are candlestick patterns that show market indecision. They have a small body with long, equal-length shadows on both sides, reflecting a balance between buyers and sellers. These patterns often signal potential trend reversals or continuations, depending on their position in the market.
Key Points:
- Structure: Small body, long upper and lower shadows.
- Market Signal: Indicates indecision, often seen near trend extremes.
- Bullish vs Bearish: Green spinning tops suggest weakening selling pressure, while red spinning tops indicate fading buying momentum.
- Trend Context: Appearing at uptrend peaks or downtrend bottoms, they hint at possible reversals.
- Confirmation Tools: Use volume analysis, RSI, MACD, and support/resistance levels to verify signals.
Spinning tops are most useful when combined with technical indicators and market context. Look for confirmation from the next candle before making trading decisions.
Unlocking the Secrets of the Spinning Top Candlestick Pattern
Structure of Spinning Top Patterns
The structure of a spinning top highlights market indecision, showcasing the balance between buying and selling pressures.
Body and Shadow Measurements
A spinning top is characterized by a small body and long upper and lower shadows. The small body indicates little price movement between the open and close, while the extended wicks suggest significant price swings, reflecting a back-and-forth struggle between buyers and sellers.
Here’s a quick breakdown of its components:
| Component | Characteristics | Market Indication |
|---|---|---|
| Body | Small real body with minimal difference between open and close | Signals market indecision |
| Upper Shadow | Long upper wick | Indicates rejection of higher prices |
| Lower Shadow | Long lower wick | Indicates rejection of lower prices |
The color of the spinning top provides additional insights into market sentiment.
Green vs Red Spinning Tops
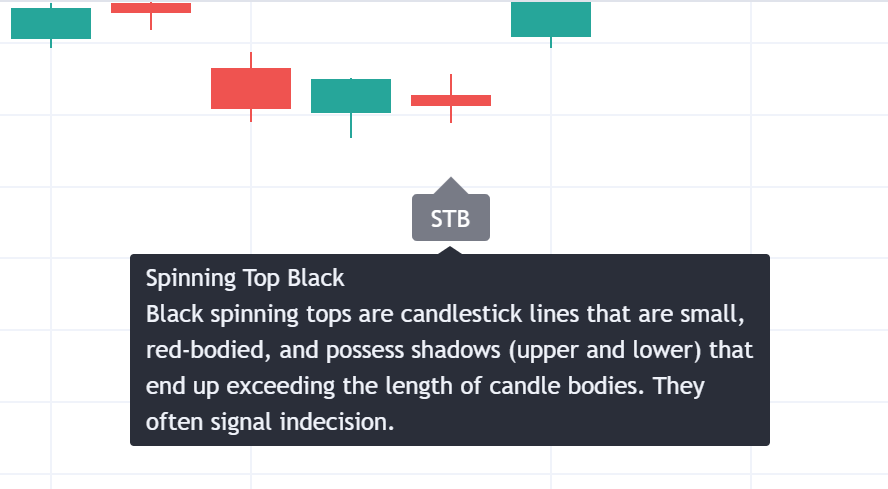
The color of the spinning top refines its message. A green spinning top (bullish) may suggest that selling pressure is weakening, especially when it appears at the end of a downtrend. On the other hand, a red spinning top (bearish), with a close slightly below the open, often hints at waning buying pressure when seen near market highs.
Spinning Tops vs Dojis
While both spinning tops and dojis represent market indecision, their structures set them apart. A spinning top has a small but noticeable body with long wicks, whereas a doji features an almost nonexistent body due to nearly identical opening and closing prices.
| Characteristic | Spinning Top | Doji |
|---|---|---|
| Body Structure | Small but visible real body | Minimal or absent body (open ≈ close) |
| Market Signal | Indicates moderate indecision | Reflects complete indecision |
| Strength of Indecision | Shows some degree of control | Reflects a complete stalemate |
| Market Context | Appears in both trending and sideways markets | Often significant at trend extremes |
The small body of a spinning top distinguishes it from a doji, signaling a different level of uncertainty in the market.
Market Context Analysis
Spinning tops often reflect market conditions that hint at potential trend reversals or continuations.
Signs of Market Uncertainty
Spinning tops signal a tug-of-war between buyers and sellers, with neither side taking control. This balance, seen in equal price movements during a session, helps traders assess market dynamics:
| Market Position | Indication | Trading Implication |
|---|---|---|
| Strong Uptrend | Losing buying momentum | Possible reversal ahead |
| Strong Downtrend | Easing selling pressure | Trend could be nearing its end |
| Sideways Market | Ongoing indecision | Likely range-bound movement |
| Support Level | Buyers testing interest | Potential bounce opportunity |
| Resistance Level | Sellers testing strength | Possible rejection zone |
These signals often act as early warnings for shifts in market trends.
Trend Changes and Continuations
Where spinning tops appear within a trend is key to their interpretation. According to Tom Bulkowski's research, spinning tops result in reversals about 50% of the time.
- In an uptrend peak: Look for signs like lower buying volume, a bearish candlestick following the spinning top, and proximity to major resistance levels.
- In a downtrend bottom: Watch for reduced selling pressure, a bullish confirmation candlestick, and movement near significant support levels.
Pattern Verification Methods
To confirm spinning top signals, use these tools:
-
Volume Analysis
- Declining volume during the spinning top formation
- Increased volume after the pattern strengthens the signal
-
Indicator Confirmation
- RSI: Measures momentum
- Moving Averages: Provides trend context
- Bollinger Bands: Highlights volatility
- MACD: Assesses trend strength
-
Support and Resistance Levels
- Price action near key levels
- Previous swing highs and lows
- Psychological price points
- Fibonacci retracement zones
"The spinning top pattern signals market indecision and often precedes trend reversals or trend continuations".
Trading Methods with Spinning Tops
Spinning tops highlight market uncertainty, but with the right approach, they can guide effective trading decisions.
Trade Entry and Exit Points
When a spinning top appears, it often signals a potential momentum shift. For long trades, look for a bullish candle that closes above the spinning top's high – this indicates buyers are gaining control. For short trades, wait for bearish confirmation with a close below the pattern's low. To strengthen your confidence, check for volume spikes and momentum indicators.
Set profit targets using tools like pivot points, Fibonacci extensions, or nearby resistance levels. Always use stop-loss orders to protect your position.
Stop Loss Placement
Place your stop loss just outside the spinning top's shadows – below the lower shadow for long trades and above the upper shadow for short trades.
"At what price is your opinion wrong?" - Investopedia
In volatile markets, use the Average True Range (ATR) to adjust your stop. For example, applying a 1.5× ATR multiplier can help you stay in the trade longer without getting stopped out prematurely, while still managing your risk effectively.
Trading Examples
Here are a few setups that combine spinning top patterns with other key indicators:
- RSI Divergence: If the RSI shows divergence during a spinning top formation, it strengthens the case for a reversal.
- Volume Analysis: High volume during the spinning top's formation followed by declining volume often signals an upcoming price move.
- Moving Averages: When spinning tops form near important moving averages like the 20-day or 50-day EMA, they can indicate potential support or resistance zones.
"The spinning top pattern reflects an uncertainty within the market, with the candlestick pattern's long upper and lower shadows indicating little change between the closing and opening price." - PrimeXBT
Advanced Pattern Analysis
Refining your approach to spinning top patterns? Multi-timeframe analysis (MTA) and other specialized methods can take your trading to the next level.
Multi-Timeframe Analysis
The "rule of four" is a simple yet effective method to apply multi-timeframe analysis. Use three charts with different timeframes: a medium-term chart as your foundation, a short-term chart at one-fourth its duration, and a long-term chart at four times its duration. This approach helps you see the market from different perspectives.
For example, a swing trader might use:
- Daily charts to assess the primary trend.
- 4-hour charts to pinpoint spinning top formations.
- 1-hour charts for precise entry points.
Patterns spotted on higher timeframes tend to hold more influence. Automated methods and thorough analysis can streamline this process and improve accuracy.
Market-Specific Patterns
Spinning top patterns can behave differently depending on the market you're trading in. Here's a quick breakdown:
| Market Type | Key Considerations for Spinning Tops |
|---|---|
| Stocks | Work best near major support or resistance levels and trend lines. |
| Derivatives | Effective in CFD trading when paired with well-placed stop-losses. |
To maximize reliability, combine spinning top signals with volume analysis and other technical tools tailored to your market. Always wait for confirmation from the next few candles, especially in volatile conditions. Monitoring overall market sentiment can also help you make more informed decisions.
Summary and Next Steps
Ready to take on spinning top patterns? Let’s recap the main points and outline how to put them into action.
Pattern Review
Spinning tops provide valuable insights into market behavior through their unique structure. These patterns emerge when neither buyers nor sellers take control, forming a small body with long upper and lower shadows. They can indicate potential trend reversals or continuations depending on market context.
Key takeaways include:
- Market Psychology: Reflect a balance between bulls and bears, signaling temporary indecision.
- Context Is Key: More meaningful near support/resistance levels or within strong trends.
- Confirmation Matters: The next candle’s direction is crucial for confirming the pattern’s significance.
Implementation Steps
| Phase | Action Steps | Key Considerations |
|---|---|---|
| Analysis | Identify the pattern’s position relative to trends and key levels | Look for patterns near support/resistance |
| Validation | Use volume and technical indicators for confirmation | Tools like RSI and MACD can help |
| Execution | Define entry/exit points with proper risk management | Set stops just beyond pattern extremes |