Understand the differences between static and dynamic support and resistance levels, and how to effectively use them in trading strategies.
Support and resistance levels are crucial for understanding price movements in trading. They help traders identify where prices might reverse or break out. These levels are categorized into static and dynamic:
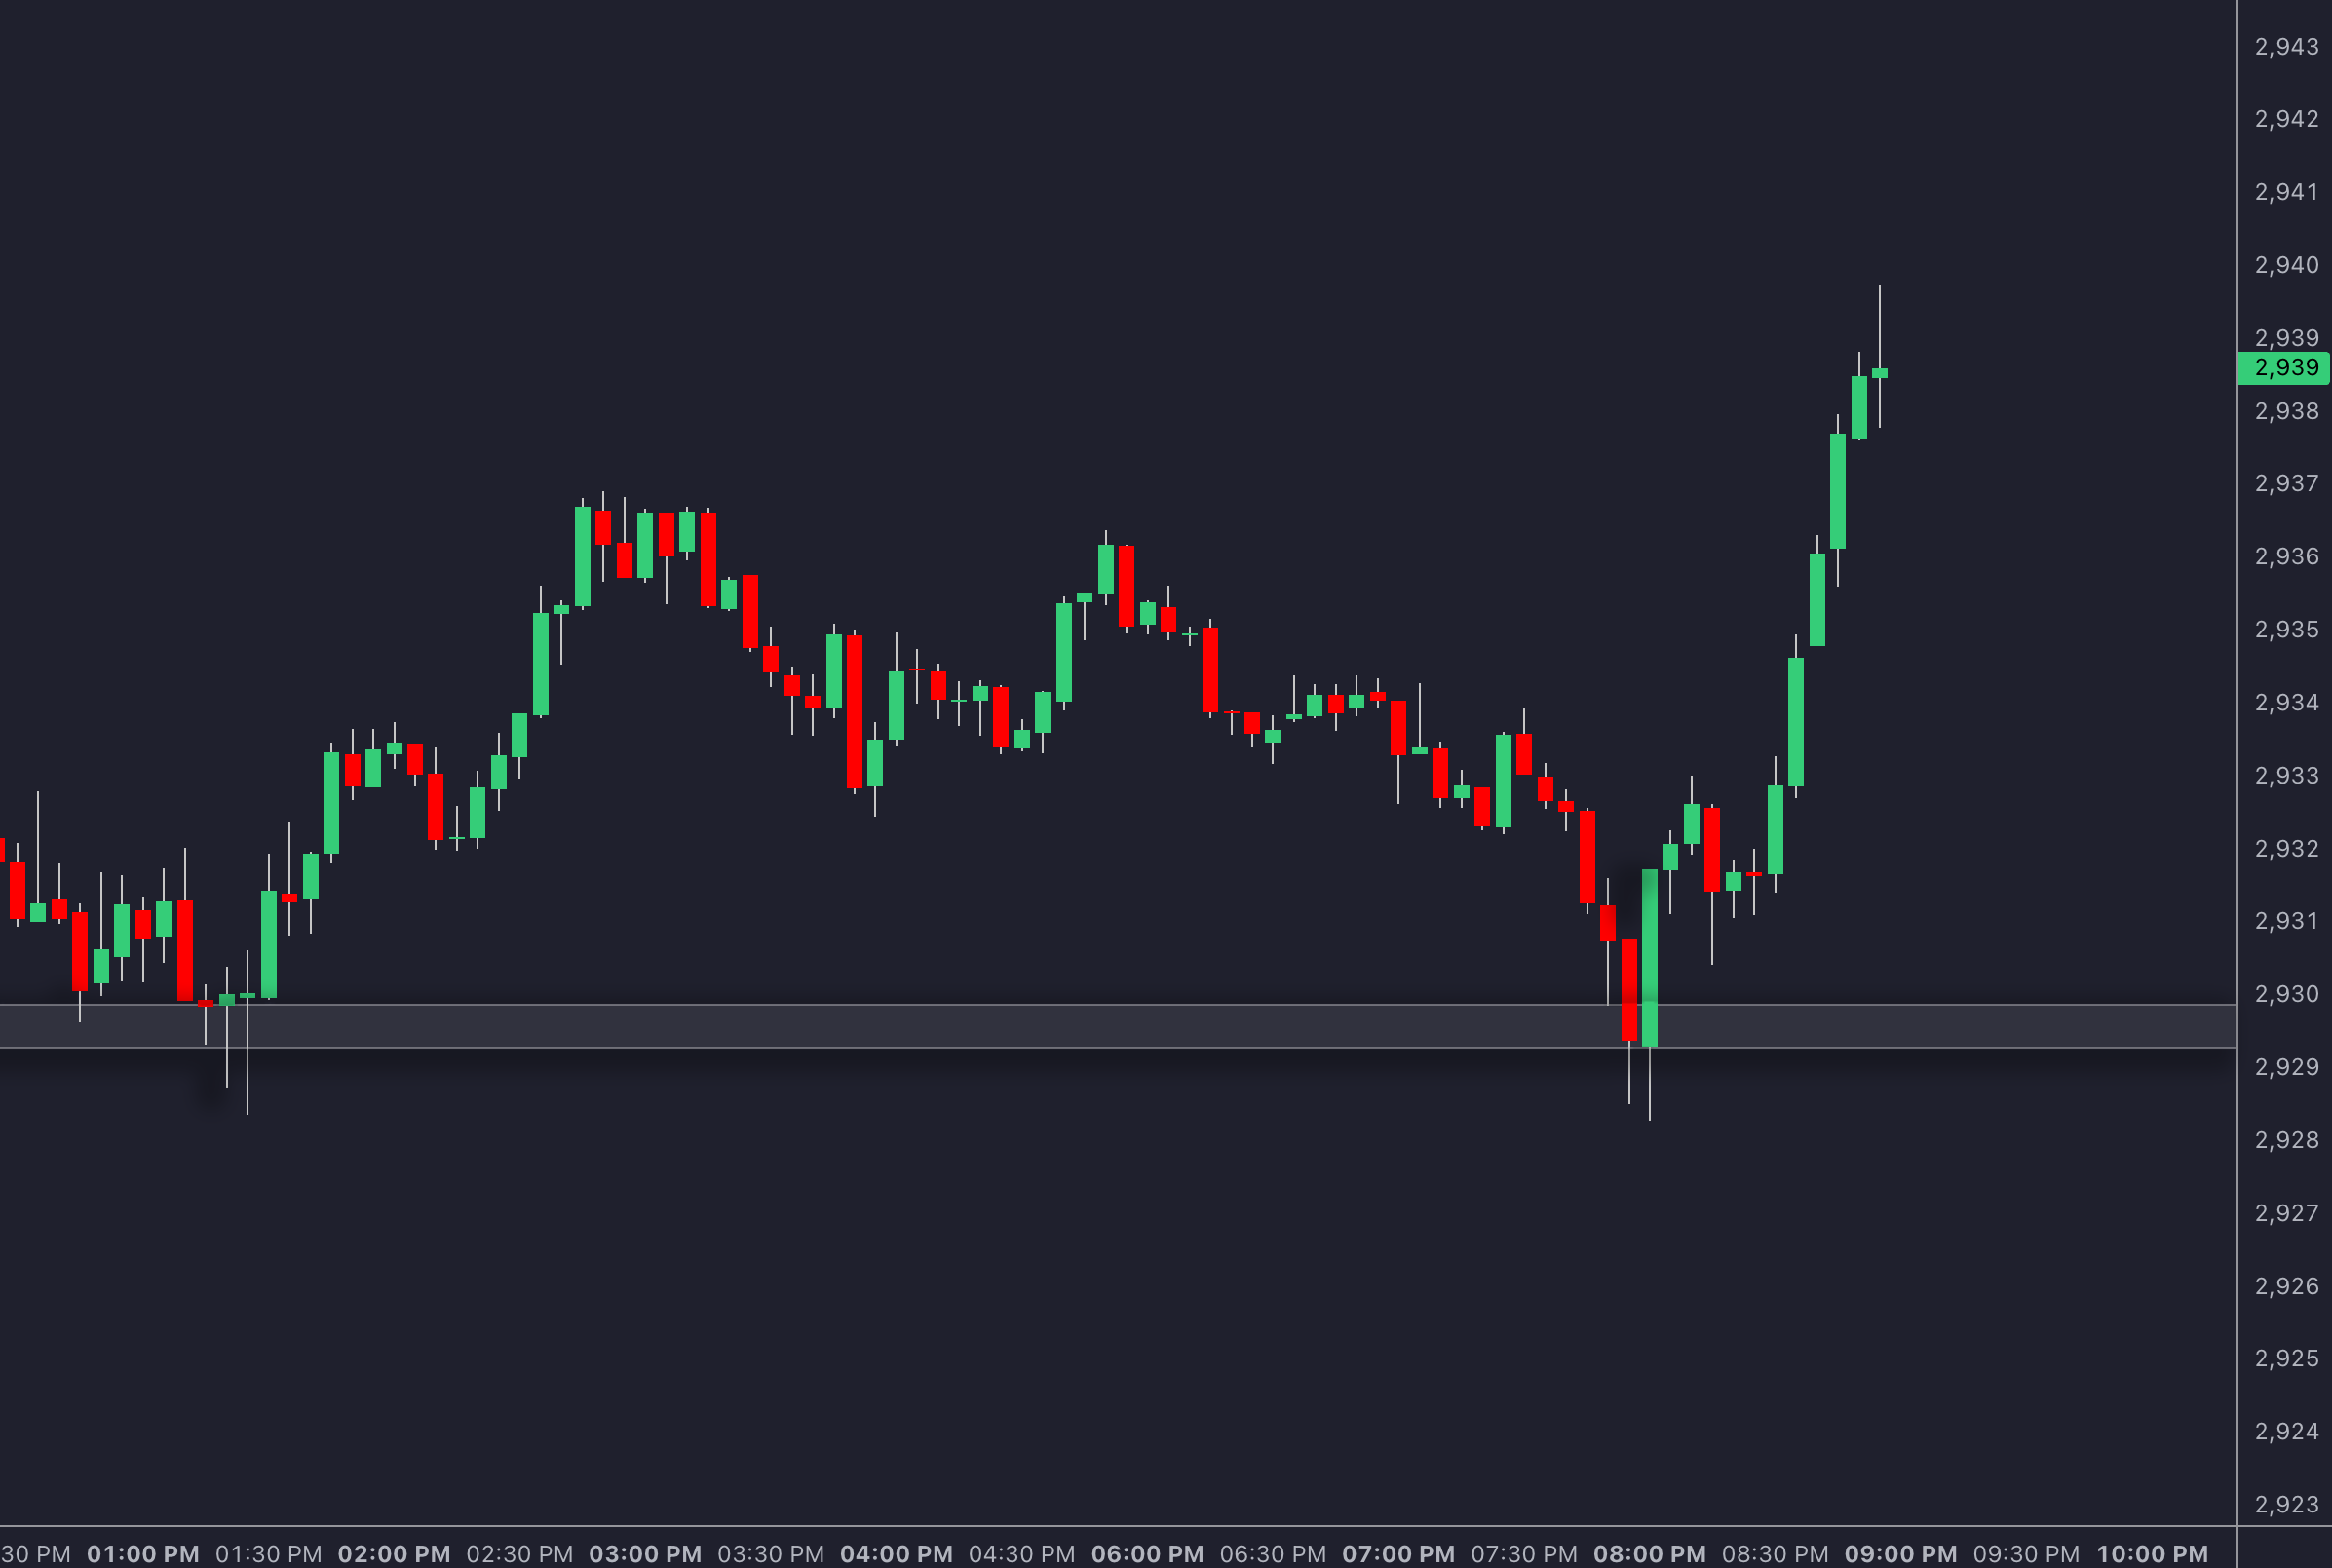
- Static Levels: Fixed price points, like previous highs/lows or psychological round numbers. Best for range-bound markets.
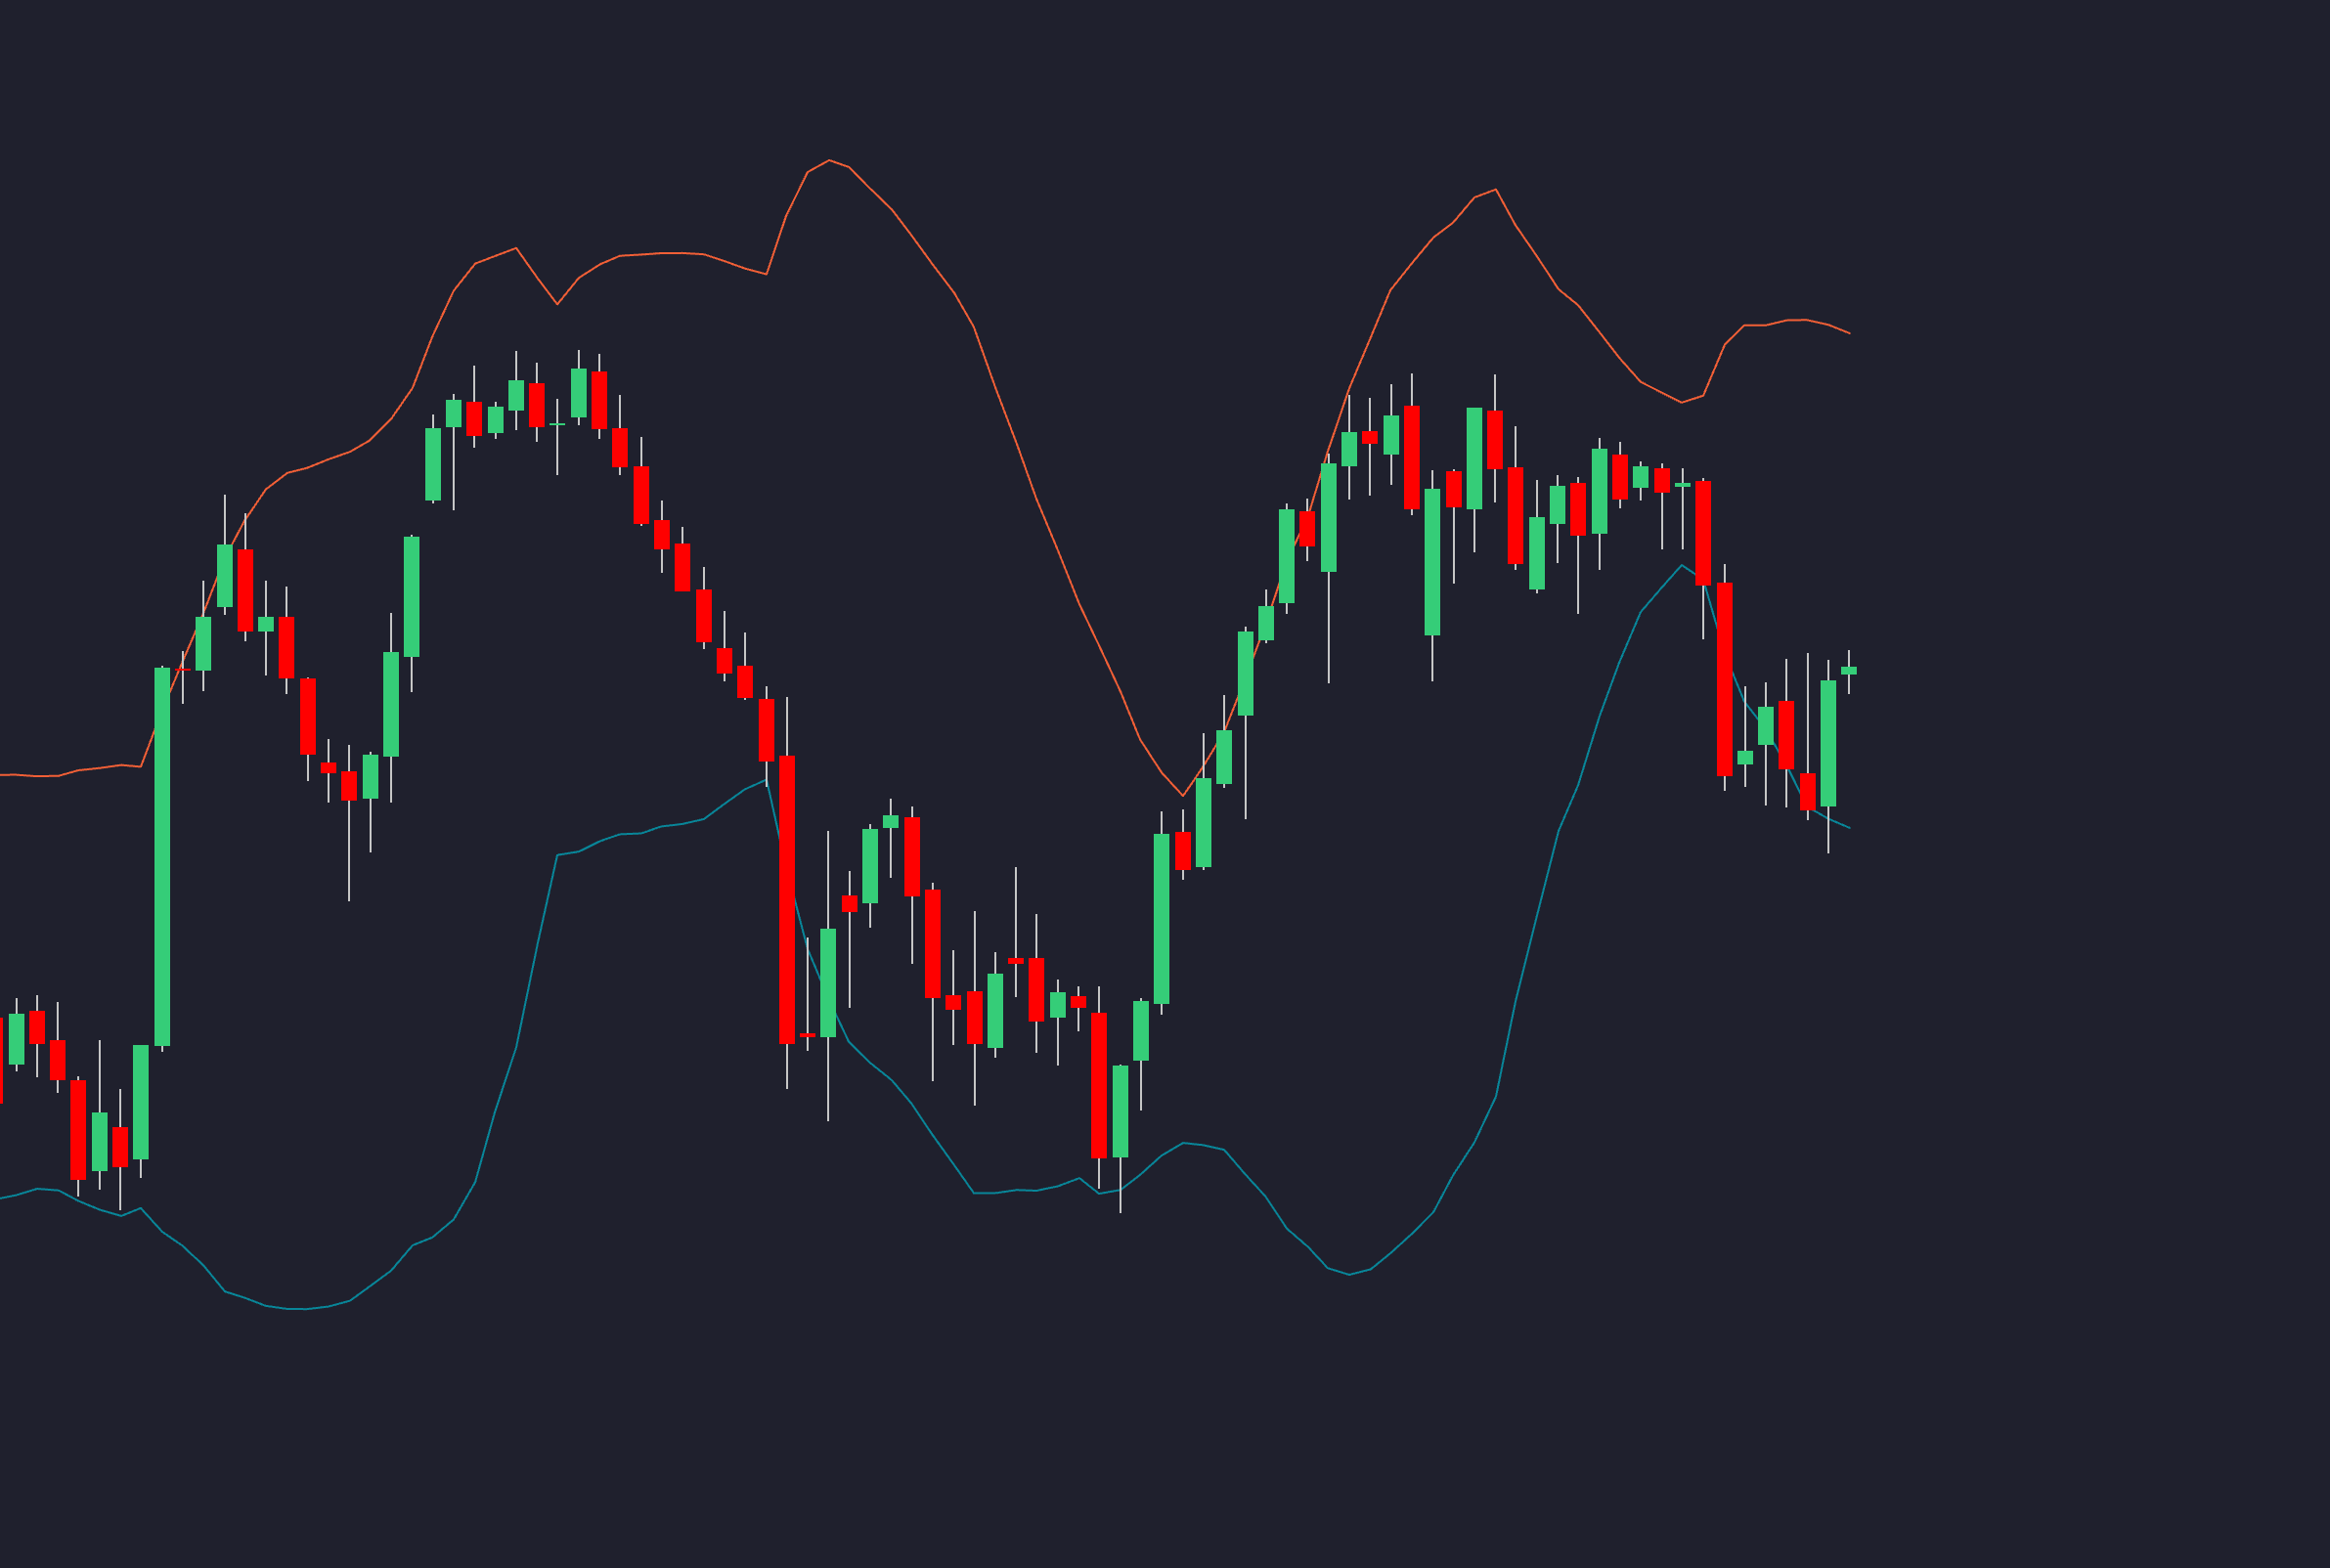
- Dynamic Levels: Real-time, moving levels based on indicators like moving averages or Bollinger Bands. Ideal for trending markets.
Quick Comparison
| Feature | Static Levels | Dynamic Levels |
|---|---|---|
| Behavior | Fixed price points | Adjust with market trends |
| Best Use Case | Range-bound markets | Trending markets |
| Examples | Previous highs/lows, pivots | Moving averages, VWAP |
| False Breakout Rate | Higher in trends (42%) | Lower with real-time updates (28%) |
| Risk Management | Fixed stop-loss placements | Trailing stops required |
Traders often combine both types to create confluence zones for more reliable signals. For example, aligning a static level like a pivot point with a dynamic indicator like a 50-day moving average can strengthen trade setups. This approach reduces false signals and improves success rates.
To get started, analyze historical price actions for static levels and use indicators like EMAs or Bollinger Bands for dynamic levels. Combining these strategies can enhance your trading results.
Static vs Dynamic Support and Resistance
Static Levels Explained
Static support and resistance levels are fixed price points in the market, often representing areas where significant buying or selling pressure occurred in the past. These levels typically form at:
- Previous major highs and lows
- Psychological round numbers
- Key pivot points from historical market reactions
For instance, Tesla stock faced strong resistance at $250 in 2023, with five rejections at that level [5]. Similarly, gold's $1,800 price point acted as a barrier for 18 months before finally breaking during the 2022 inflationary period [3].
Dynamic Levels Explained
Dynamic support and resistance levels adjust in real-time, relying on technical indicators that respond to market changes.
| Indicator Type | Accuracy Rate | Best Use Case |
|---|---|---|
| Volume-weighted MA | 63% | Trending markets |
| Ichimoku Cloud | 58% | Multi-timeframe analysis |
| Bollinger Bands | 55% | Volatility-based trading |
A good example is Amazon's price action. During bull market phases, the lower Bollinger Band successfully caught 78% of pullbacks, demonstrating how dynamic levels can provide more responsive trading signals compared to static ones [6].
Comparison: Static vs Dynamic Levels
The differences between static and dynamic levels become clear when looking at how they perform in different market conditions:
| Characteristic | Static Levels | Dynamic Levels |
|---|---|---|
| False Breakout Rate | 42% in trends | 28% with real-time updates |
| Risk Management | Fixed stop placement | Trailing stops required |
These two types of levels often complement each other. For example, when a daily pivot point (static) aligns with a 200-period moving average (dynamic), it creates a stronger confluence zone [6].
In Q3 2023, EUR/USD faced five false breakouts at the static resistance level of 1.1000. However, the dynamic VWAP resistance at the same level produced only two valid rejections [5][6]. Similarly, crude oil traders often use wider fixed stops below static levels, while tighter trailing stops are preferred for dynamic levels.
How to Find Support and Resistance
Finding Static Levels
To identify static support and resistance levels, focus on analyzing historical price movements and trading volume. The goal is to pinpoint price zones where multiple reversals have occurred. These levels become more reliable when they coincide with areas of high trading activity.
Look for clusters of swing points with at least three confirmed touches to define dependable static levels. For instance, during gold's 2024 consolidation, the price rejected the $2,075 level three times before eventually breaking higher. Similarly, high-volume clusters at specific price zones further reinforce the importance of static levels. A good example is Bitcoin's consolidation in early 2024, where the $42,000 level consistently showed high trading volume and later acted as a key support during market pullbacks.
While static levels are based on past price action, dynamic levels require real-time tools and indicators.
Finding Dynamic Levels
Dynamic support and resistance levels are identified using tools like moving averages and other real-time indicators. Moving averages, such as the 20-day EMA and 50-day MA, are particularly effective in trending markets.
These levels work best when markets exhibit clear trends and predictable volatility patterns. Tools like the Volume Weighted Average Price (VWAP) are especially useful for short-term trading. For example, when prices deviate more than 1% from the VWAP, it often signals a strong momentum shift.
"The 2024 NVDA correction showed false breaks of 50-day MA before resuming uptrend. Experts recommend combining MAs with momentum indicators like RSI for confirmation" [1][7]
Bollinger Bands® adjust to market volatility, providing dynamic levels for potential reversals. In 2024, when the S&P 500 traded between $450 and $465 during a period of low volatility, touches of the upper band often indicated overbought conditions, while the lower band acted as reliable support.
Trendlines connecting swing highs and lows also help identify dynamic levels. However, steeper trendlines are generally less sustainable, making them weaker over time.
These methods lay the groundwork for applying support and resistance levels effectively in trading strategies, which will be covered in the next section.
Trading Strategy Guide
Choosing Between Static and Dynamic Levels
The type of market you're trading in often dictates whether static or dynamic levels will serve you better. Static levels work well in markets that are moving sideways, where prices bounce within clear boundaries. For example, in a range-bound stock market, static levels offer dependable areas of support and resistance.
On the other hand, dynamic levels shine in trending markets. A common example is the 50-day moving average, which often acts as a support level during uptrends, especially in commodity markets [2][6].
The best results often come when these levels are used together with other confirmation signals. We'll explore this in real-market examples later.
Using Both Level Types Together
When you combine static and dynamic levels, you create zones of confluence that can significantly improve the reliability of your trades. These confluence zones—where, for instance, a moving average aligns with a historical level or a trendline meets a horizontal price level—tend to provide stronger signals than either level type on its own [6].
Focus on these intersections across multiple timeframes to identify high-probability setups.
Risk Control Methods
Effective risk management builds on the unique traits of static and dynamic levels. For static levels, fixed stop-loss placements are straightforward. In contrast, dynamic levels require more flexible stops, which was highlighted in the earlier comparison table.
Volume plays a crucial role in confirming breakout validity. Look for breakouts that occur with at least 150% of the average volume to filter out false signals [7].
For trending markets, use trailing stops tied to dynamic levels. For instance, set stops at a distance of 2x the Average True Range (ATR) from the 20-period EMA. This approach provides enough room for price fluctuations while protecting your gains [2][4].
When it comes to position sizing, adjust based on the setup:
- Smaller positions (30% less) for trades relying solely on dynamic levels.
- Full-sized positions when static and dynamic levels align.
- Partial exits near opposing levels to lock in profits.
These techniques balance risk and reward while adapting to various market conditions.
Tools for Support and Resistance Analysis
Static Level Tools
Using the right tools can make identifying static levels much easier. Many trading platforms now offer helpful features like Fibonacci tools for marking swing-based levels or pivot calculators for analyzing daily ranges. Volume profiles are another great option, as they highlight areas with high trading activity. These tools are particularly effective in range-bound markets, where static levels tend to work best.
For example, volume profile analysis pinpoints price zones with heavy trading activity, which often turn into reliable static levels.
Dynamic Level Tools
Dynamic tools adjust to shifting market conditions, making them ideal for tracking support and resistance in real time. Some of the most commonly used indicators include:
- Moving Averages: The 50-EMA is often used as dynamic support in uptrends [6].
- Bollinger Bands: These create flexible price channels, helping to spot potential reversal points [1].
- VWAP (Volume Weighted Average Price): This is a key tool for intraday trading, with studies showing that 68% of institutional traders use it to define trading ranges [6].
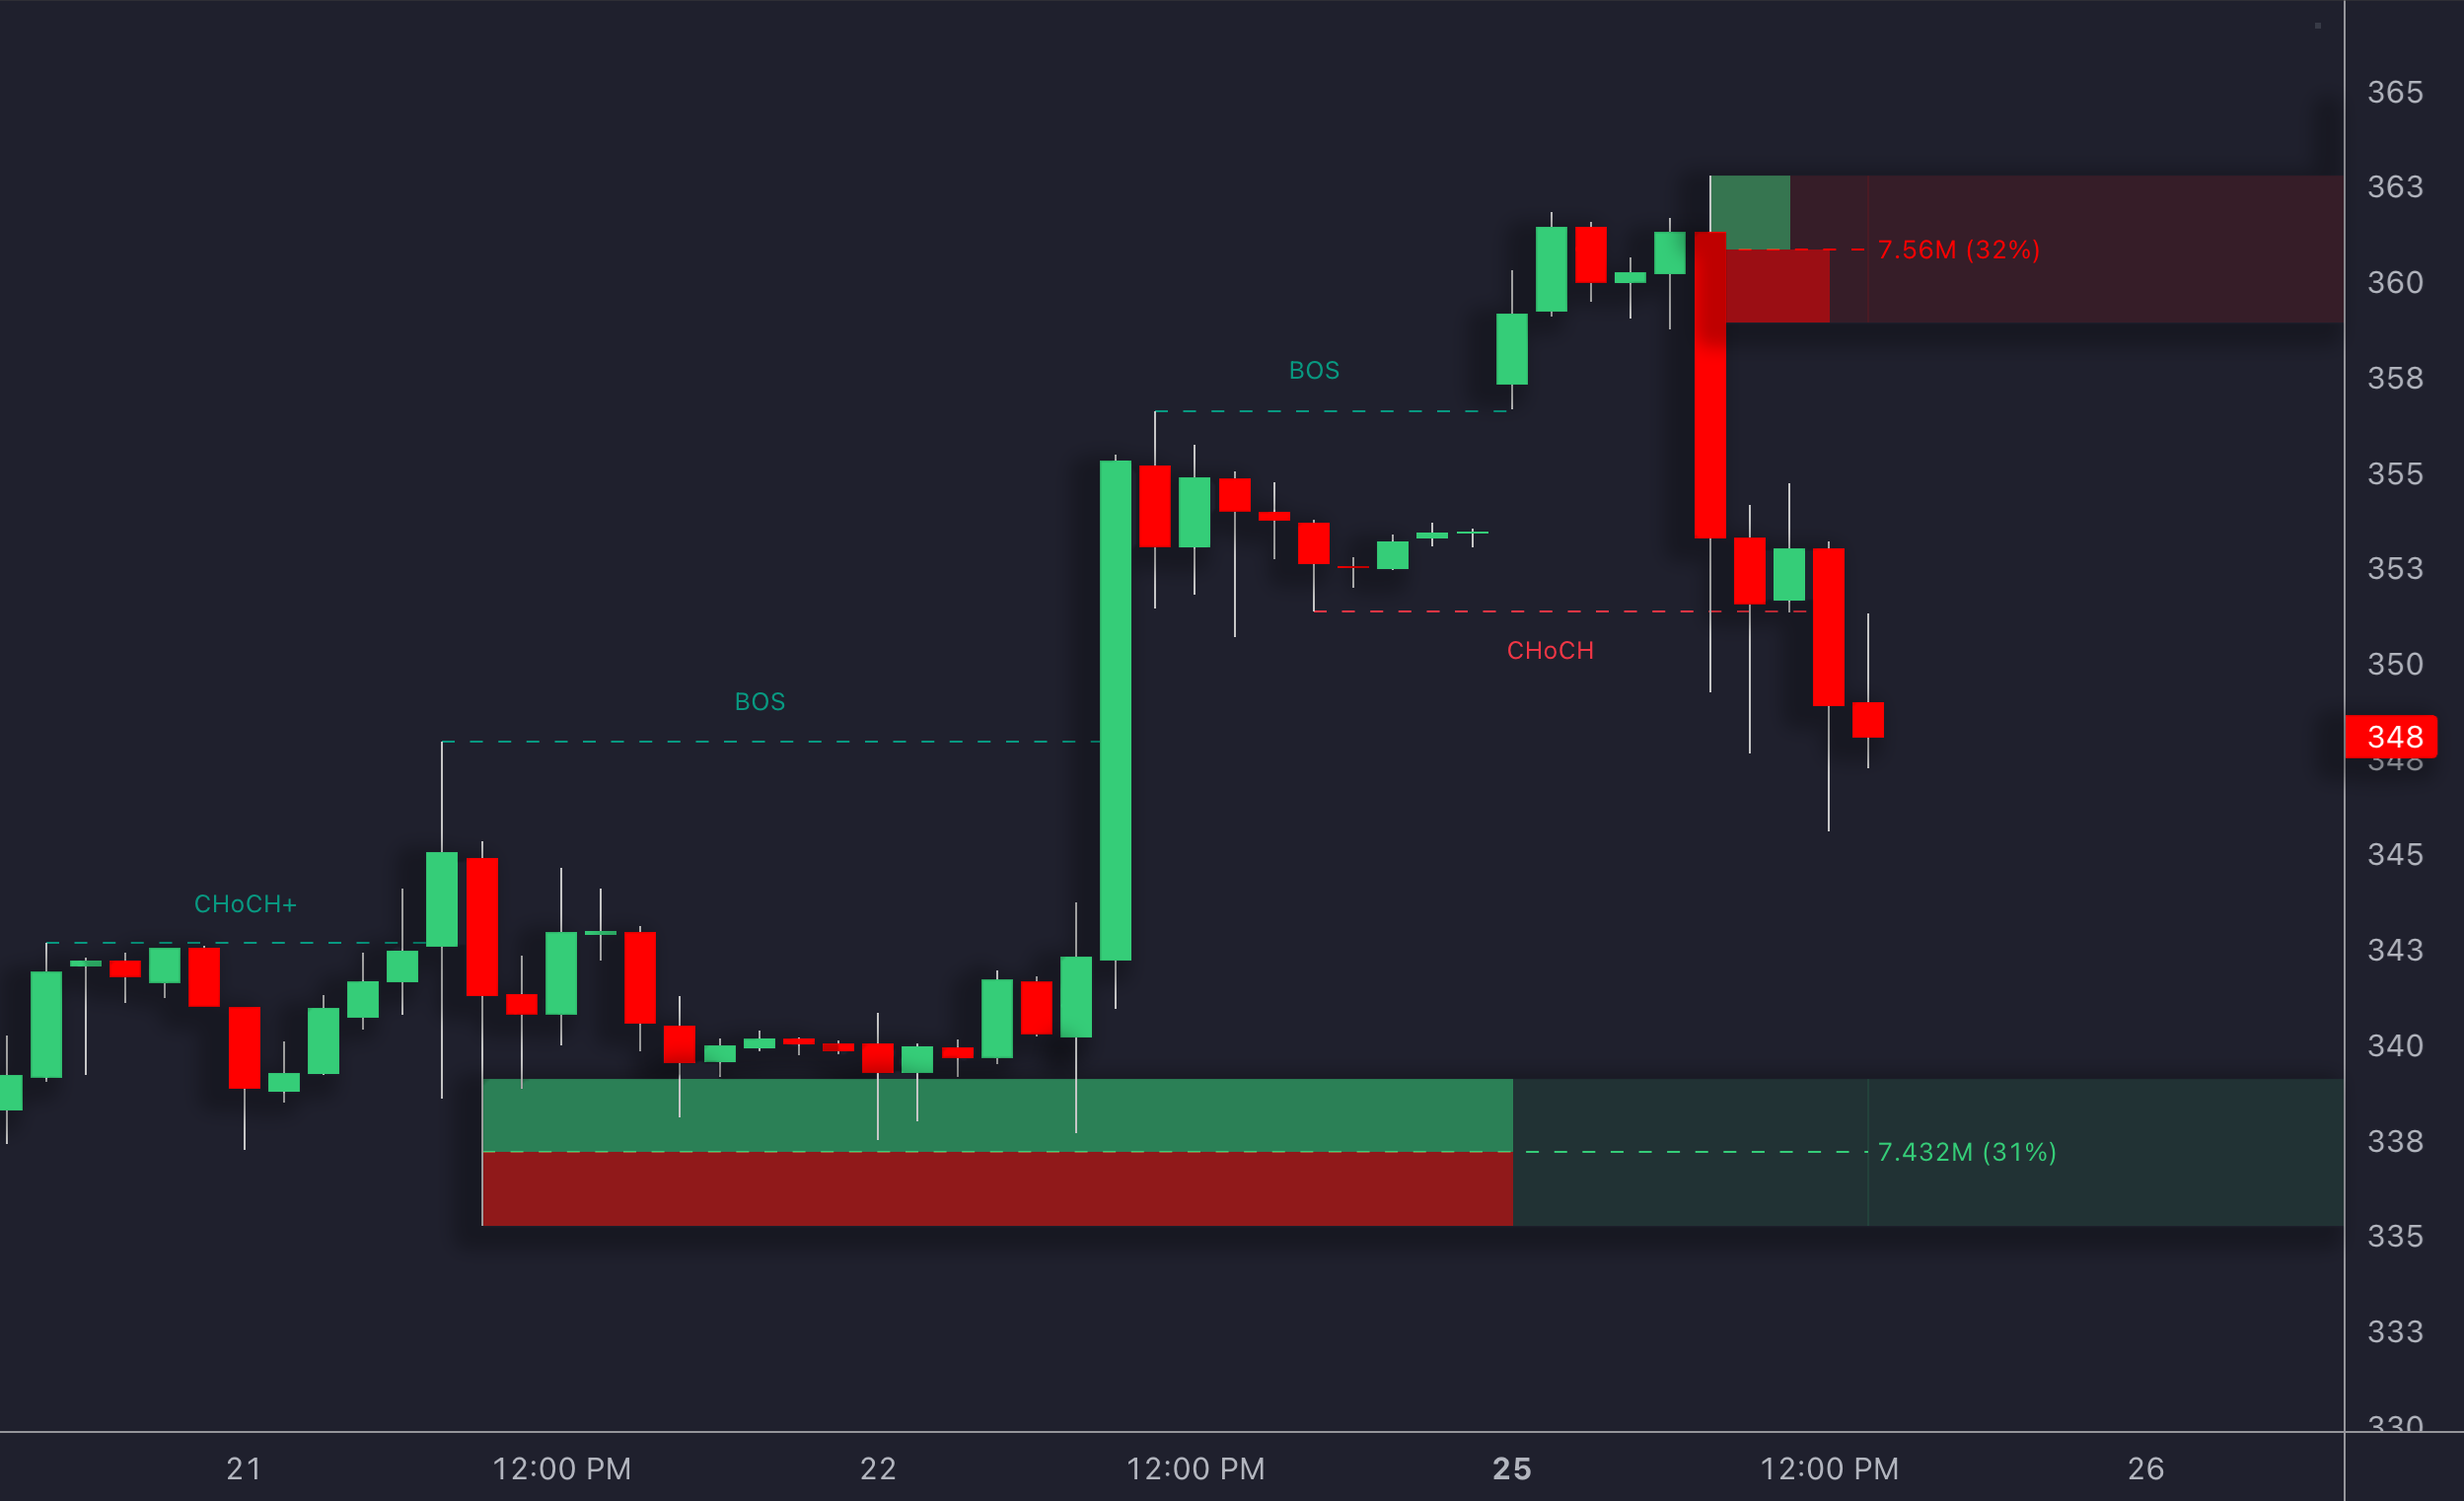
LuxAlgo Volumetric Order Blocks
A more dynamic and advanced way to detect support and resistance levels is through LuxAlgo’s volumetric order blocks. These highlight price areas where more informed market participants accumulate orders and can be used as potential areas of support or resistance. They are automatically highlighted by the toolkit and will disappear once mitigated.
Volumetric Order Blocks are separated into two types:
- Bullish Volumetric Order Blocks: Their initial locations are near swing lows and are used as potential support.
- Bearish Volumetric Order Blocks: Their initial locations are near swing highs and are used as potential resistance.
Users can show longer term Volumetric Order Blocks by increasing the Length setting in the Order Blocks section. This setting controls the swing point detection lookback used to construct Volumetric Order Blocks.
Summary
Main Points
Support and resistance analysis becomes much more effective when traders use both static and dynamic levels wisely. Static levels work best in range-bound markets, offering clear entry points with defined boundaries. For example, during the 2024 Asian trading sessions, forex pairs respected static levels 78% of the time due to lower volatility [6].
Dynamic levels, however, adjust to market momentum and are more reliable in trending markets. The 2023 S&P 500 rally highlighted this - static levels produced 38% false signals, while dynamic indicators like EMAs performed consistently throughout the trend [6]. Their ability to adjust makes them especially useful during volatile periods or major news events.
Getting Started
To build an effective support and resistance strategy, start by creating a structured analysis framework. Backtesting shows that combining static and dynamic methods improves risk-reward ratios by 23% compared to using a single approach [6].
For example, you can pair static levels from daily charts with dynamic indicators like the 50 EMA for confirmation. This combination has proven effective, with traders reducing false signals by 58% while still hitting profit targets [7].
Here are some practices to improve your results:
- Use volatility-adjusted stops (e.g., 1.5x ATR beyond static levels).
- Focus on setups where static and dynamic levels align.
- Analyze multiple timeframes to find overlapping signals.
Modern tools can simplify this process. For instance, LuxAlgo’s Dynamic SR Indicator automatically identifies confluence zones across multiple timeframes, while their AI Backtester has shown integrated strategies boosting returns by 19% in 2024 tests.
FAQs
What is dynamic support and resistance?
Dynamic support and resistance levels adjust in real time, making them especially useful in trending markets. Research shows that institutional traders often achieve better outcomes when combining these levels with tools like volume analysis and confirmations across multiple timeframes [6].
Traders typically validate dynamic levels by looking for:
- Price reactions at key indicator levels
- Volume spikes that align with these levels
- Options flow that supports the trend
For swing trading, the 4-hour timeframe tends to work best. Position traders, on the other hand, often rely on weekly charts, using tools like the 200-week moving average as a key dynamic reference point [5].
These levels become even more effective when paired with static support and resistance, as highlighted in our strategy integration examples.
References
- Bollinger Bands - Wikipedia
- Support and Resistance - Wikipedia
- CenterPoint Securities: Support and Resistance
- 2nd Skies Forex: Dynamic Support and Resistance
- NetPicks: Using Dynamic Support and Resistance
- IndicatorVault: Support and Resistance Levels
- The Secret Mindset: Support and Resistance Trading