Explore the differences between static and dynamic support in trading, including their advantages, drawbacks, and ideal market conditions.
Static and dynamic support are critical for understanding market trends, but they serve different purposes:
- Static Support: Fixed price levels based on historical data. Best for long-term trading and range-bound markets.
- Dynamic Support: Adjusts with price movement using tools like moving averages. Ideal for short-term trading and trending markets.
Quick Comparison:
| Characteristic | Static Support | Dynamic Support |
|---|---|---|
| Price Level Behavior | Fixed historical points | Adjusts with market movements |
| Best Market Conditions | Range-bound trading | Trending markets |
| Primary Tools | Historical data, Fibonacci | Moving averages, Bollinger Bands |
| Reaction Speed | Slower response | Faster response |
| Trading Timeframe | Long-term trades | Short-term trades |
Key Insight: Use static support for clear entry/exit points in stable markets, and dynamic support for adapting to trends. Combining both can enhance trading strategies by identifying strong convergence zones.
Static Vs. Dynamic Support and Resistance
Static Support Analysis
Static support focuses on price levels that remain unchanged over time, building on the fundamentals of support and resistance.
How Static Support Works
Static support refers to fixed price levels where significant buying activity has occurred in the past. These levels are often tied to major lows, round numbers, or key turning points in the market. Unlike dynamic support, they don’t shift with price movements.
Here are three common ways to identify static support:
| Method | Description | Best For |
|---|---|---|
| Historical Highs/Lows | Identifying major peaks and troughs | Long-term trend analysis |
| Fibonacci Retracements | Using ratios to assess price movements | Spotting potential reversal zones |
| Price Action Analysis | Observing repeated price reversals | Identifying strong support/resistance zones |
These methods help traders pinpoint reliable price levels for decision-making.
Benefits of Static Support
Static support offers several advantages for traders:
- Proven reliability: The longer a level holds, the more meaningful it becomes.
- Clear entry and exit points: Fixed levels simplify trade planning with precise targets.
- Pattern validation: When a level is tested multiple times, it strengthens confidence in its importance.
Modern features such as the Price Action Concepts (PAC) toolkit—one of the exclusive offerings on TradingView—help automate the process of detecting these levels, making analysis faster and more efficient.
Drawbacks of Static Support
While useful, static support has its downsides:
- Lack of flexibility: These levels don’t adjust to evolving market conditions.
- Zone interpretation: Support often acts as a range rather than a specific price point.
- Market dependency: Its effectiveness varies based on market type.
| Market Type | Effectiveness |
|---|---|
| Range-bound | High – offers clear boundaries |
| Trending | Limited – levels may lose relevance |
| Volatile | Moderate – requires broader zones |
To address these challenges, skilled traders combine static support with other technical tools and remain adaptable in their interpretations. This approach ensures a more comprehensive analysis of market behavior.
Dynamic Support Analysis
While static support relies on fixed price levels, dynamic support adjusts as market conditions shift.
How Dynamic Support Works
Dynamic support levels change with the market, making them ideal for active traders. These levels are calculated using technical indicators that move with price trends.
Here are some of the most commonly used dynamic support indicators:
| Indicator | Application | Best Timeframe |
|---|---|---|
| 20 EMA | Tracks short-term trend direction | Intraday to daily |
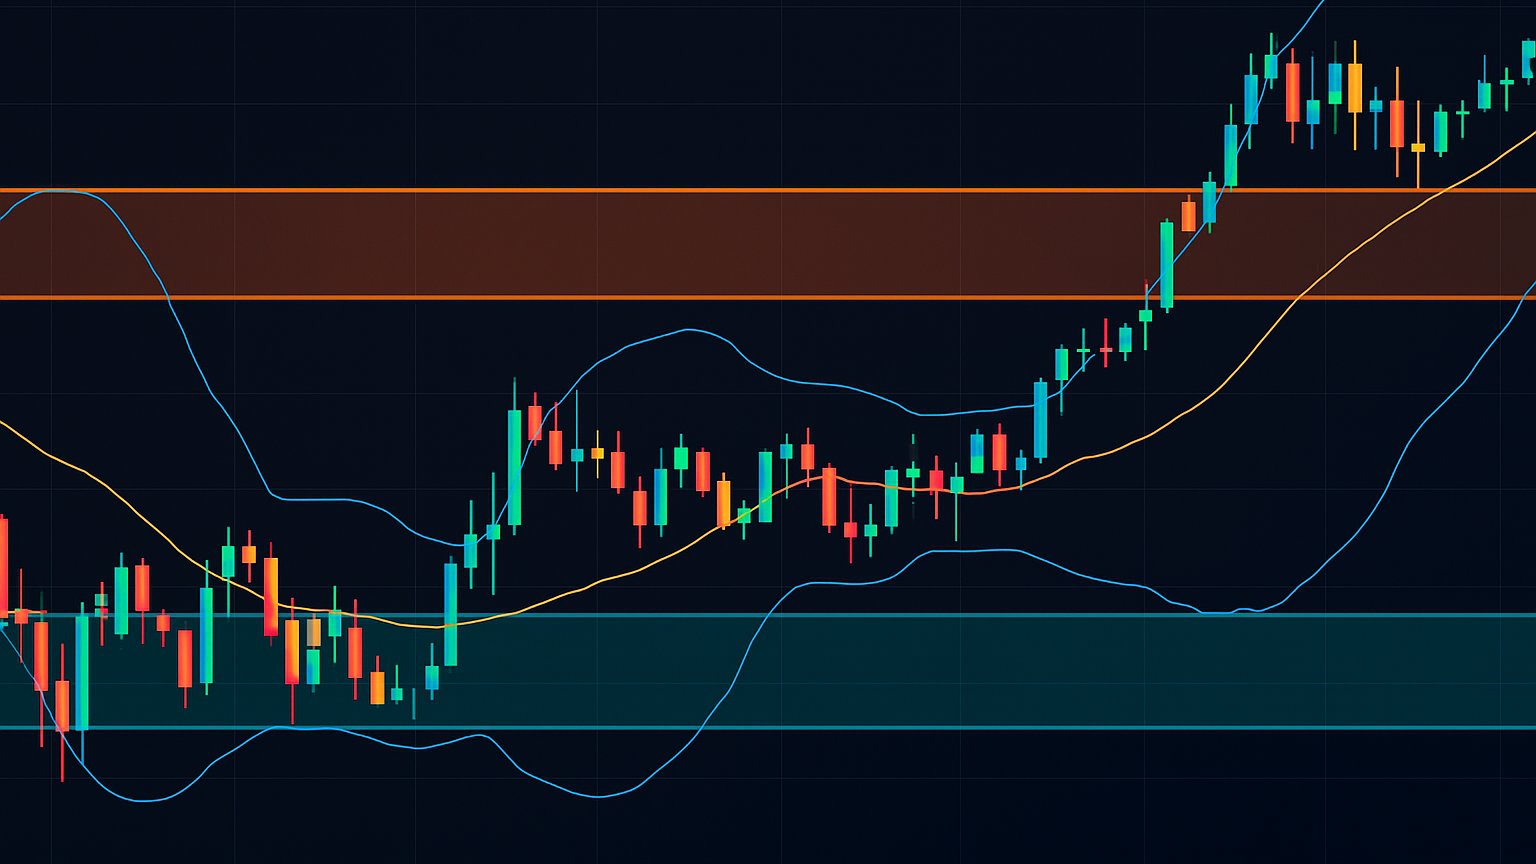
| Bollinger Bands | Sets boundaries based on volatility | Multiple timeframes |
| Ichimoku Cloud | Projects future support areas | Daily to weekly |
These indicators update automatically as new price data comes in, keeping support zones current. For example, in an upward trend, dynamic support levels rise with the price, offering relevant reference points for traders.
Benefits of Dynamic Support
Dynamic support provides several key advantages:
Market Responsiveness
- Adjusts to volatility and changing trends in real time.
- Reflects shifts in market sentiment quickly.
Trading Efficiency
- Eliminates the need for manual plotting of support and resistance levels.
- Provides clear signals during trending markets.
- Helps spot potential reversals earlier.
The Signals & Overlays toolkit—another exclusive offering on TradingView—enhances dynamic support analysis by offering automated trend detection and real-time updates, which is especially useful for short-term traders managing multiple assets.
Drawbacks of Dynamic Support
Despite its strengths, dynamic support has some limitations:
| Challenge | Impact | Mitigation Strategy |
|---|---|---|
| False Signals | Can occur frequently in choppy markets | Confirm with longer timeframes |
| Lag Effect | Indicators may trail behind price action | Combine with leading indicators |
| Complexity | Requires understanding of multiple tools | Start with simple moving averages |
Dynamic support works well during strong trends but can produce noise and misleading signals in ranging markets. To address this, many traders combine dynamic and static support levels—especially during transitional phases—to ensure more reliable validation of support zones while retaining flexibility.
Static vs Dynamic Support Head-to-Head
Let’s break down how static and dynamic support compare when it comes to market analysis.
Key Differences Table
Here’s a quick look at how these two approaches stack up:
| Characteristic | Static Support | Dynamic Support |
|---|---|---|
| Price Level Behavior | Fixed historical levels | Adjusts with market movement |
| Best Market Conditions | Range-bound trading | Trending markets |
| Primary Tools | Historical data, Fibonacci | Moving averages, Bollinger Bands |
| Setup Complexity | Simple to identify and plot | Requires indicator setup |
| Reaction Speed | Slower response | Faster response |
| Trading Timeframe | Long-term trades | Short-term trades |
Market Condition Performance
Market conditions play a big role in how effective static and dynamic support can be:
Trending Markets
- Dynamic support shines in strong trends, often using tools like the 20 EMA to track price movements.
- Static support, however, can quickly lose relevance as prices move far from historical levels.
Range-Bound Markets
- Static support works well to define boundaries in range-bound conditions.
- Dynamic indicators, on the other hand, may produce too much noise, leading to false signals.
High Volatility
- Dynamic support adapts quickly to rapid price changes, using tools like Bollinger Bands to stay relevant.
- Static levels remain unchanged, but their usefulness can diminish during extreme volatility.
Trading Style Match
Your trading style determines which type of support might work best:
Short-Term Trading
- Dynamic support is ideal for scalpers and day traders who need quick, real-time adjustments.
- It provides instant reference points for fast entries and exits.
Swing Trading
- Swing traders can use static levels for spotting major reversals while combining them with dynamic indicators to confirm trends.
Position Trading
- Static support is more reliable for long-term strategies, as historical levels remain meaningful over extended periods.
For traders looking to streamline their analysis, the Signals & Overlays toolkit—another exclusive offering on TradingView—offers automated, real-time updates to enhance support identification.
Using Both Support Types Together
Combining Support Methods
Blending static and dynamic support creates a well-rounded trading strategy. When static support levels align with dynamic indicators, they form convergence zones that increase the reliability of trading signals.
Here’s how you can combine the two effectively:
- Use static levels to mark major price zones.
- Apply dynamic indicators to confirm the market's trend direction.
- Focus on areas where static and dynamic supports overlap.
- Adjust your position size based on how strong the convergence appears.
This approach leverages static levels to outline the market structure while dynamic indicators fine-tune your entry and exit points. For example, when a static support level aligns with a rising 20-day moving average, it creates a stronger support zone, offering better trading opportunities.
This combination strategy lays the groundwork for practical use in real trading scenarios.
Trading Example
Imagine a situation where the price nears a static support level that previously acted as resistance, and at the same time, a 20-day exponential moving average (EMA) aligns with that level. In this case:
- Enter trades with tighter stop-loss levels.
- Adjust position size based on how strong the convergence is.
- Use the dynamic EMA as a trailing stop.
- Watch the static level closely for potential breakout movements.
This dual-support approach minimizes false signals, giving you clearer entry and exit points compared to using just one type of support.
To apply this effectively, use features that integrate both static and dynamic support.
Support Analysis Tools
As mentioned earlier, combining static and dynamic support improves trade analysis. Advanced trading platforms can analyze both support types simultaneously. For instance, the Signals & Overlays toolkit—another exclusive offering on TradingView—offers features like:
- Automated identification of static support and resistance zones.
- Dynamic indicator overlays for added precision.
- Alerts when convergence occurs.
- Visual tools to showcase the strength of support levels.
These features streamline the analysis process while allowing you to customize your strategy for more precise results.
Conclusion: Picking Your Support Method
Comparing Static and Dynamic Support
Static and dynamic support methods play distinct roles in trading strategies. Here's a quick comparison to help clarify their differences:
| Characteristic | Static Support | Dynamic Support |
|---|---|---|
| Price Level Behavior | Fixed historical points | Adjusts with market movements |
| Best Market Conditions | Range-bound trading | Trending markets |
| Analysis Tools | Historical data, Fibonacci | Moving averages, Bollinger Bands |
| Implementation Speed | Slower to respond | Reacts quickly |
Ideal Scenarios for Each Method
Static support works well for:
- Position trading within defined ranges
- Identifying historically important price levels
- Setting clear profit targets and stop-loss points
- Low-volatility market environments
Dynamic support shines in:
- Short-term trades during strong trends
- Adapting to high-volatility conditions
- Using trailing stops effectively
- High-momentum trading periods
Choosing the right method depends on the market conditions and your trading goals. Once selected, focus on testing and fine-tuning for better results.
Tips for Testing and Tailoring Your Approach
When testing, use a paper trading account to experiment with each method. For static support, start by identifying key price levels on longer timeframes. For dynamic support, try standard indicators like the 20-day moving average, then adjust settings based on performance.
| Time Frame | Testing Approach | Key Tools |
|---|---|---|
| Long-term | Focus on static price levels | Historical price data |
| Medium-term | Combine static and dynamic | Moving averages, static zones |
| Short-term | Prioritize dynamic support | Real-time technical indicators |


