Learn how to identify and trade symmetrical triangle patterns, manage risks, and utilize volume indicators for better market decisions.
Symmetrical triangle patterns are essential for traders to spot potential price breakouts. These patterns form when price movements are compressed between two converging trendlines, signaling market indecision. Here’s a quick breakdown:
- Formation: Lower highs and higher lows create a triangular shape.
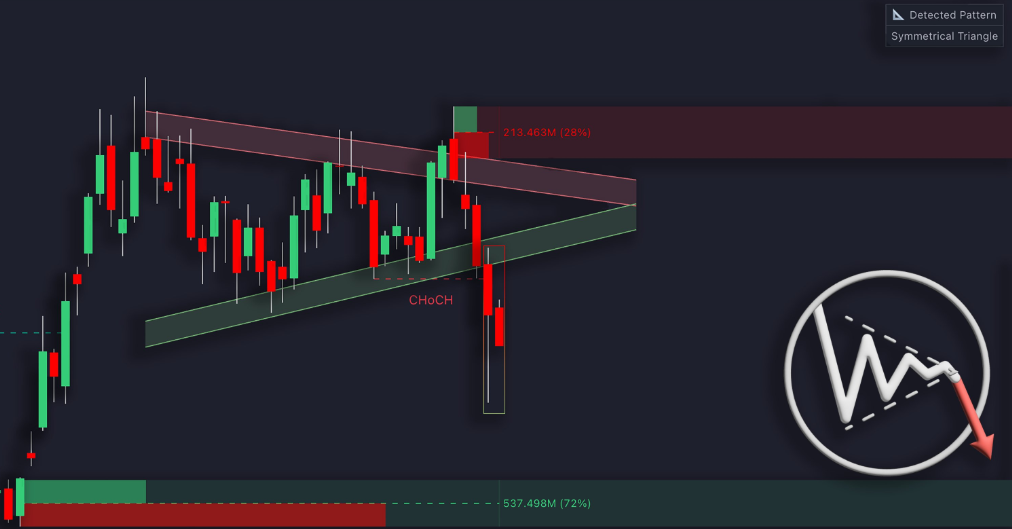
- Volume: Decreases during formation; spikes during breakouts.
- Breakout Direction: Can go up or down, depending on market context.
- Key Indicators: Look for a 3% price move beyond trendlines, supported by a 150-200% volume increase.
- Risk Management: Use stop-losses near opposite trendlines or based on volatility (e.g., ATR).
Traders can maximize success by combining these patterns with tools like LuxAlgo's Price Action Concepts toolkit on TradingView, and carefully managing risks to avoid false signals.
How to Trade Symmetrical Triangle Breakout Chart Patterns
Pattern Components
A symmetrical triangle pattern has specific elements that traders need to understand to spot and trade it effectively. Its structure gives insight into market behavior and possible price shifts.
Trendline Structure
This pattern forms when two trendlines converge, each touching at least two highs and lows. It typically develops over 3 to 6 weeks before reaching its apex [1][3]. This narrowing reflects market indecision, with neither buyers nor sellers taking control [2].
Volume Behavior
Volume plays a crucial role in confirming symmetrical triangle patterns. A spike in volume often confirms a breakout, regardless of the prior trend direction - a key detail in market analysis [2][3].
Breakout Signs
Key breakout indicators include:
- A price close exceeding the trendline by 3%
- A volume increase of 150-200% compared to the average
- Formation occurring within the 3-6 week timeframe [2][3]
For instance, LuxAlgo offers the Price Action Concepts toolkit on TradingView that helps traders identify these signals across various timeframes.
These criteria are essential for filtering out false signals, a topic we'll delve into further in the Pattern Types and Risks section.
Trading Methods
Trading symmetrical triangle patterns requires a structured plan for entries, exits, and risk management.
Entry Points
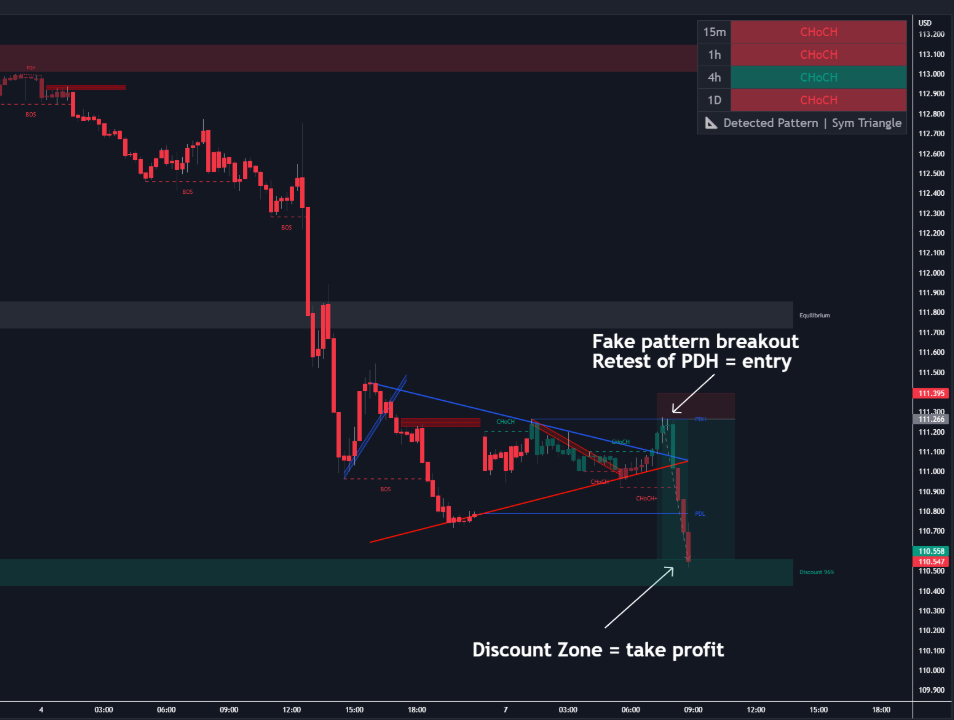
Enter when a breakout is confirmed with a noticeable increase in volume. For those looking for a safer approach, consider waiting for the price to retest the broken trendline. This often offers a lower-risk setup with tighter stop-loss levels[1].
Stop-Loss Placement
Placing stop-loss orders correctly helps manage risk effectively when trading triangle patterns. The best placement depends on your market entry method:
| Entry Type | Stop-Loss Placement | Reason |
|---|---|---|
| Breakout | Below the opposite trendline[3] | Shields against false breakouts |
| Retest | Below the retest low (for longs) or above the retest high (for shorts)[1] | Provides tighter risk control |
| Pre-apex | 2-3 ATR from entry[5] | Accommodates market volatility |
For volatile markets, ATR-based stops are a practical choice. A common rule is to set stops 2-3 ATR levels away from your entry point[5].
Exit Rules
To trade triangles profitably, establish clear exit rules based on the pattern's size and the market's behavior. The main profit target is calculated by measuring the height of the triangle and projecting it from the breakout point[3].
"The price target for a breakout or breakdown from a symmetrical triangle is equal to the distance from the high and low of the earliest part of the pattern applied to the breakout price point"[3].
Consider a scaled exit strategy to lock in profits:
- Take partial profits once the price reaches the measured move target.
- Use a 2-3 ATR trailing stop for the remaining position.
- Close the entire position if the price fails to hit the target within 1.5 times the triangle's formation period[2].
If market conditions change significantly, exit early. Look for warning signs like opposing chart patterns or shifts in volume, which might indicate a failed breakout.
These exit strategies are especially important when dealing with false signals - a topic covered in the next section on Pattern Types and Risks.
Pattern Types and Risks
Symmetrical triangles provide clear trading strategies, but understanding their biases and potential failures is crucial for effective risk management.
Market Bias Types
Symmetrical triangles often reflect specific market tendencies based on their position within a trend. Recognizing these tendencies is key for improving trade outcomes:
| Bias Type | Characteristics | Breakout Direction Probability |
|---|---|---|
| Neutral | Forms during consolidation without a clear direction | Equal probability |
| Bullish | Appears in uptrends, hinting at an upward breakout | 45% success rate[6] |
| Bearish | Forms in downtrends, pointing to a downward breakout | 55% success rate[6] |
On average, confirmed breakouts show upward moves gaining 19%, compared to an 18% decline for downward breakouts[6]. Traders should adjust position sizes based on these probabilities and consider the broader market conditions.
Avoiding False Signals
Algorithmic trading has increased the frequency of false breakouts in today's markets[3]. To identify genuine signals, traders can rely on three key validation steps:
- Price Action: Wait for a full candle close beyond the trendline.
- Apex Proximity: Breakouts occurring near the pattern's apex are more likely to fail.
LuxAlgo's Price Action Concepts toolkit enhances these processes by automating pattern verification and incorporating volume analysis, helping traders confirm authentic breakouts while cutting through market noise.
Recognizing Failed Patterns
In trending markets, failed breakouts can lead to sharp counter-moves. For example, Bitcoin's June 2022 false breakout resulted in a 45% price drop. Common signs of failure include immediate price reversals, declining volume, and technical divergences.
To manage failed patterns effectively:
- Exit trades if the price re-enters the pattern.
- Set stop-loss orders within the opposite trendline.
- Reduce exposure as the pattern approaches its completion.
While symmetrical triangles maintain a 75% success rate as continuation patterns[1], traders must stay prepared for sudden market shifts and volatility that can disrupt even well-constructed setups.
Analysis Tools
Modern trading platforms provide advanced resources to help traders identify and analyze symmetrical triangle patterns. These tools combine automated detection with confirmation indicators, enabling more informed decision-making.
Pattern Detection Software
LuxAlgo's Price Action Concepts toolkit is designed to improve pattern detection. It builds on breakout confirmation methods outlined in Pattern Components. Notable features include multi-timeframe validation and volume-based breakout alerts.
Supporting Indicators
Using multiple technical indicators alongside symmetrical triangle patterns can improve trading precision. Here's how some key indicators work with these patterns:
| Indicator | Primary Function | Pattern Confirmation Method |
|---|---|---|
| RSI | Measures momentum | Identifies divergence and overbought/oversold levels |
| MACD | Assesses trend strength | Looks for signal line crossovers near breakout points |
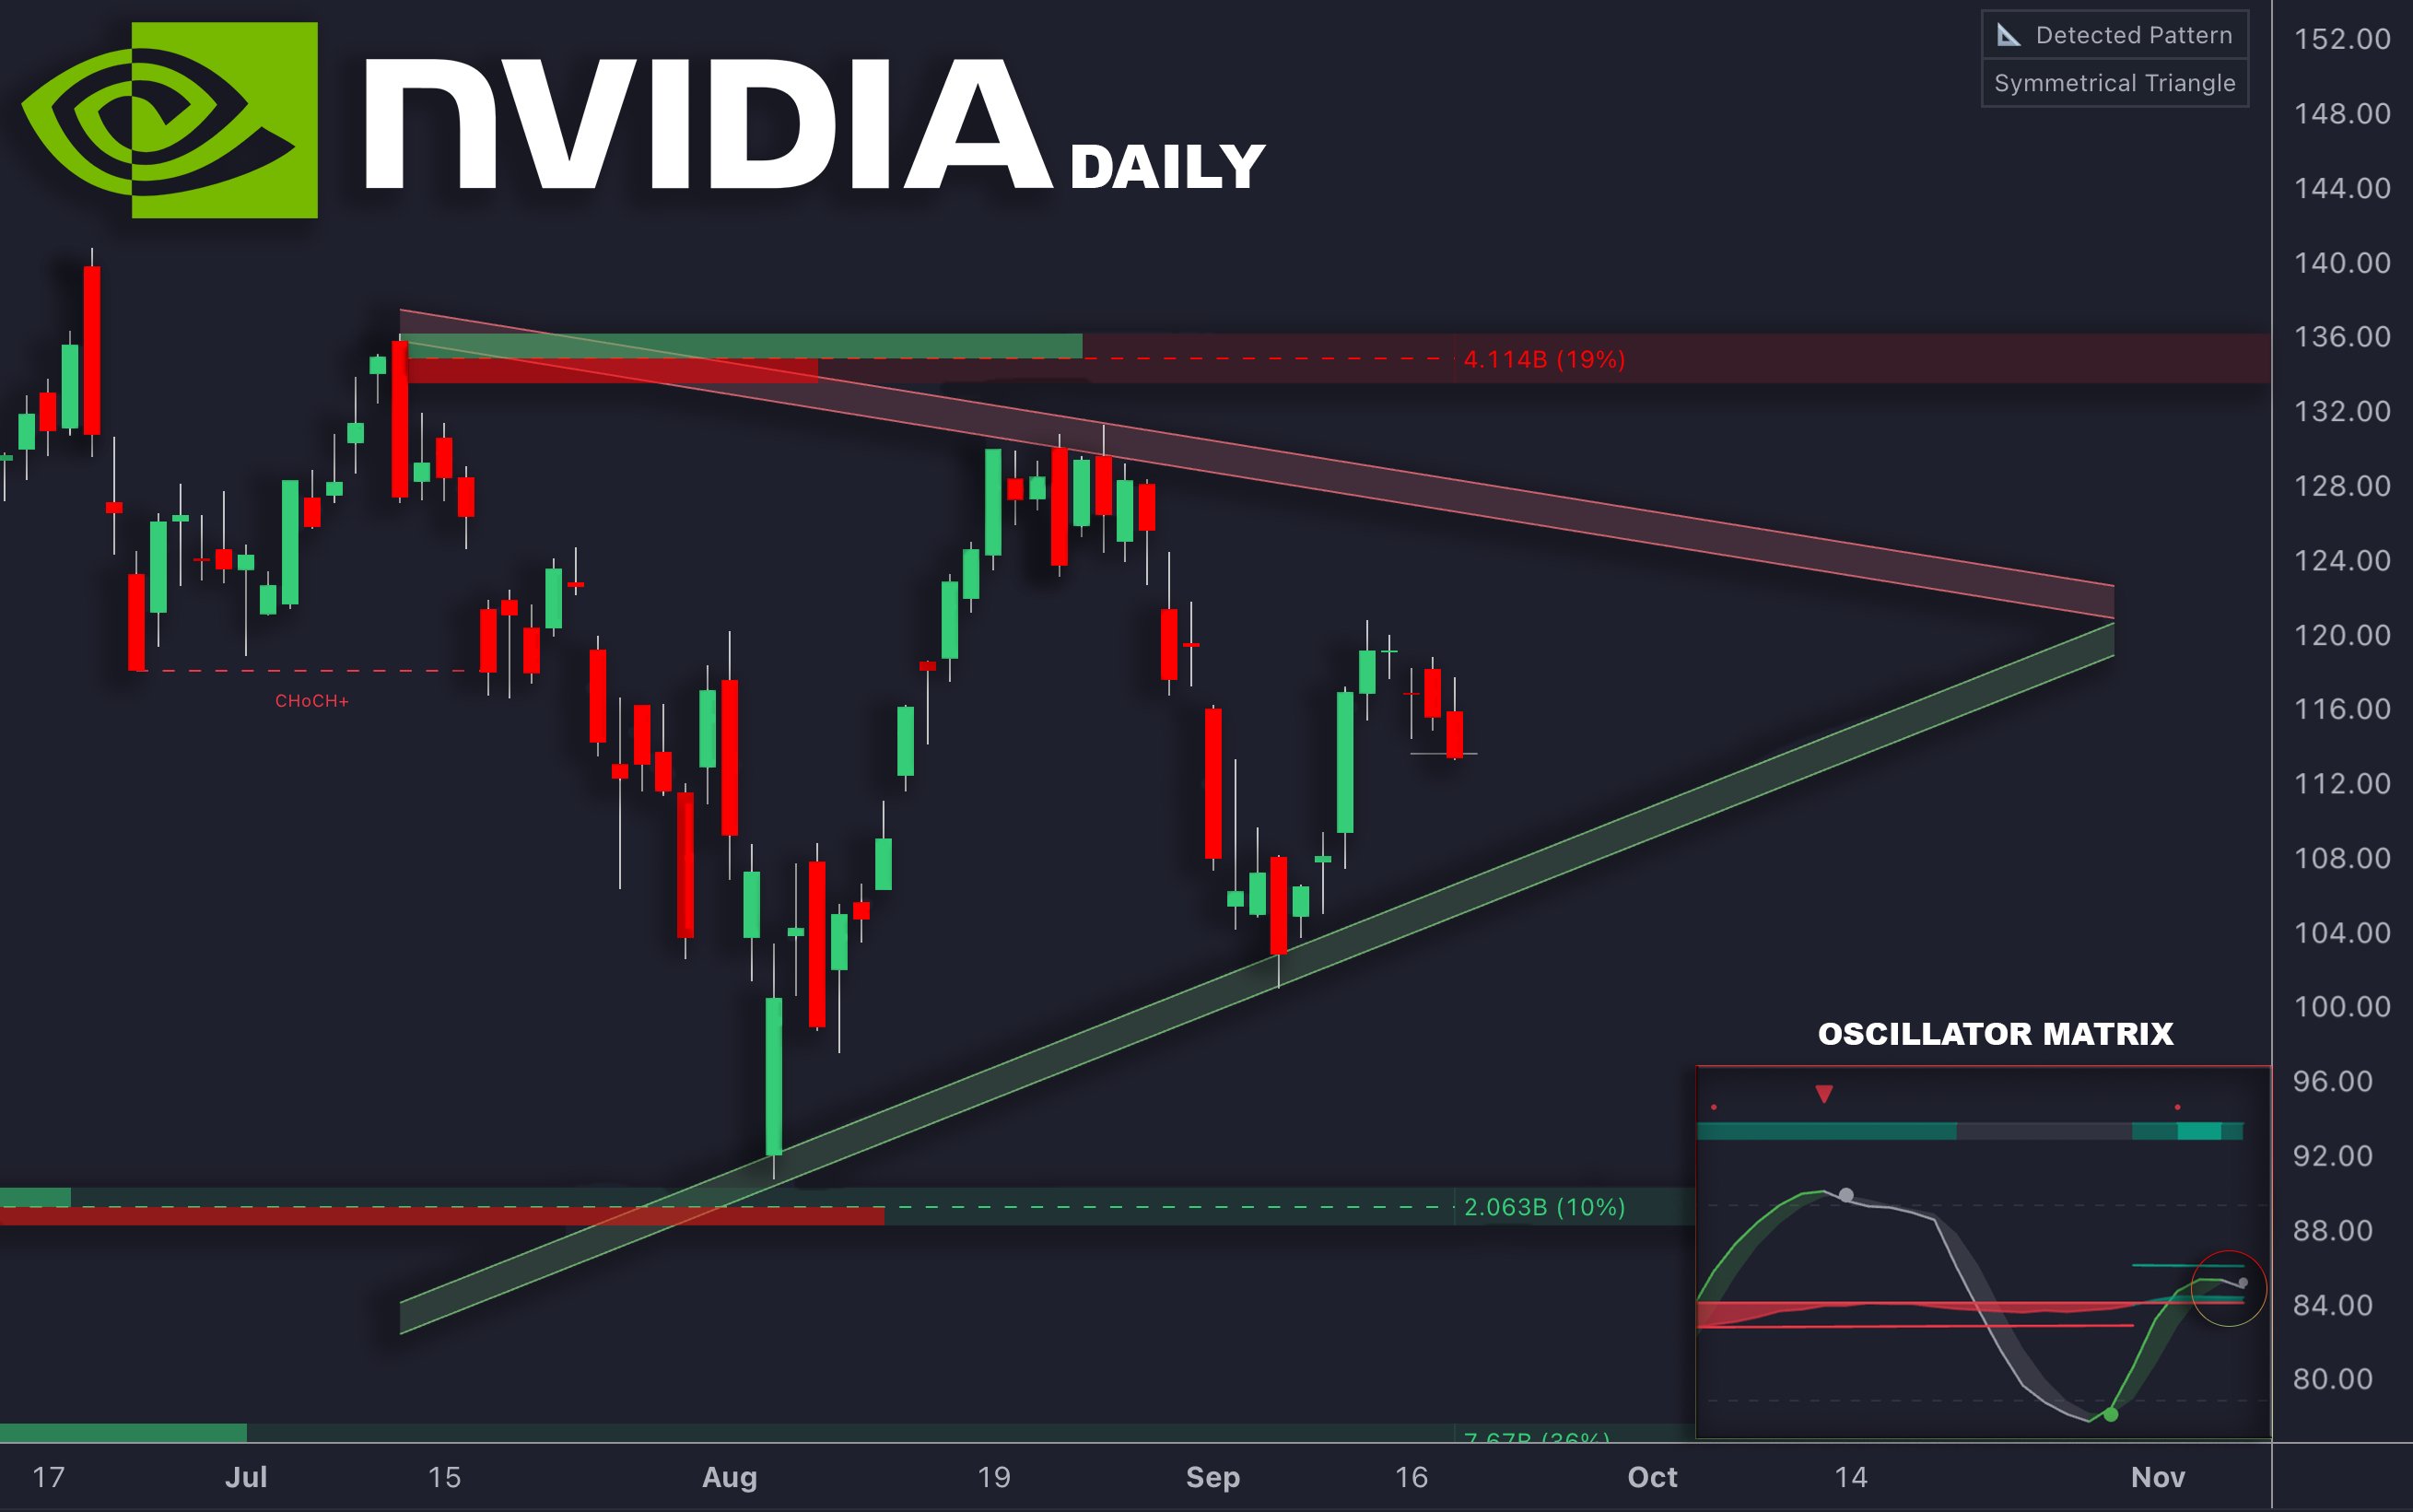
LuxAlgo's Oscillator Matrix toolkit adds real-time divergence detection and trend-following signals, which help confirm triangle breakouts. For example, if a stock breaks above a symmetrical triangle's resistance line, a MACD crossover above its signal line could reinforce the bullish outlook[4].
Testing Methods
LuxAlgo's AI Backtesting Assistant is tailored for testing triangle pattern strategies across different assets and timeframes.
1. Strategy Validation
Traders can evaluate pattern recognition across various assets and timeframes. Symmetrical triangles have shown a 54% success rate for upward breakouts and 50% for downward breakouts.
2. Performance Optimization
The platform allows traders to fine-tune recognition parameters and adjust risk controls.
3. Risk Assessment
Probabilistic simulations provide insights into strategy performance under different market scenarios, helping traders understand potential drawdowns and risk-adjusted returns.
These products work together to create a reliable system for trading symmetrical triangles, directly supporting the risk management strategies discussed in Pattern Types and Risks.
Conclusion
Main Points
Symmetrical triangle patterns are a key element in technical analysis, appearing in both trending and ranging markets. Their standout feature is the formation of two converging trendlines that create a triangular consolidation zone[2]. These patterns are most effective when paired with volume confirmation and sound risk management strategies.
Take Tesla's August 2022 breakout as an example - it delivered a 16.5% gain after a confirmed breakout with volume. This case highlights the potential of these patterns when accurately identified and traded with supporting data.
Tools and Practice
LuxAlgo provides hundreds of free trading indicators, exclusive toolkits, and an AI Backtesting platform that offer automated detection and backtesting features to help traders apply these strategies. By combining these exclusive products with strong risk management, traders can take advantage of high-probability setups with greater confidence.
Further Learning
To excel at trading symmetrical triangles, focus on building these essential skills:
- Pattern recognition: Hone your ability to spot triangles through regular chart analysis.
- Volume analysis: Use volume data to confirm breakouts[1].
- Risk management: Ensure proper stop-loss placement for controlled risk[3].
- Multi-timeframe analysis: Incorporate insights from different timeframes for a broader perspective.
Keep in mind that throwbacks happen in 57% of cases and pullbacks in 59%, which can help you set realistic expectations and manage trades more effectively[8].
Mastery comes from practice. Start with demo trading to test your strategies without risk, and consistently review your performance to fine-tune your approach. By applying the methods discussed, you can develop a reliable system for trading symmetrical triangles.
FAQs
How do you trade symmetrical triangle patterns?
Trading symmetrical triangles involves a clear strategy centered on confirmation and managing risk. The main goal is to wait for a definitive breakout signal before making a move.
For a bullish breakout, look for the price to close above the upper trendline with higher trading volume. For a bearish breakout, wait until the price closes below the lower trendline, again with strong volume backing it up. Place your stop-loss just inside the opposite trendline or near the last key swing high or low within the pattern.
Key steps to follow:
- Confirm breakouts by analyzing volume.
- Use measured move targets to set profit goals.
- Consider the broader market context when trading.
- Watch for false signals and validate using volume thresholds.
These methods align with the volume analysis techniques discussed in Pattern Components.
What is the symmetrical triangle rule?
The symmetrical triangle rule outlines key guidelines for identifying valid patterns and trading them effectively. The main rule is that the price must create a series of lower highs and higher lows, forming converging trendlines with nearly equal angles.
As explained in Pattern Components, valid symmetrical triangles require:
- A drop in volume during pattern formation.
- A 75% likelihood of continuing the prior trend [8].
- Better reliability when they appear within established trends.
Risk management tips:
- Only enter a trade after confirming the breakout.
- Set stop-loss orders slightly beyond the opposite trendline [1].
- Exit the trade if the breakout lacks volume confirmation [3].


