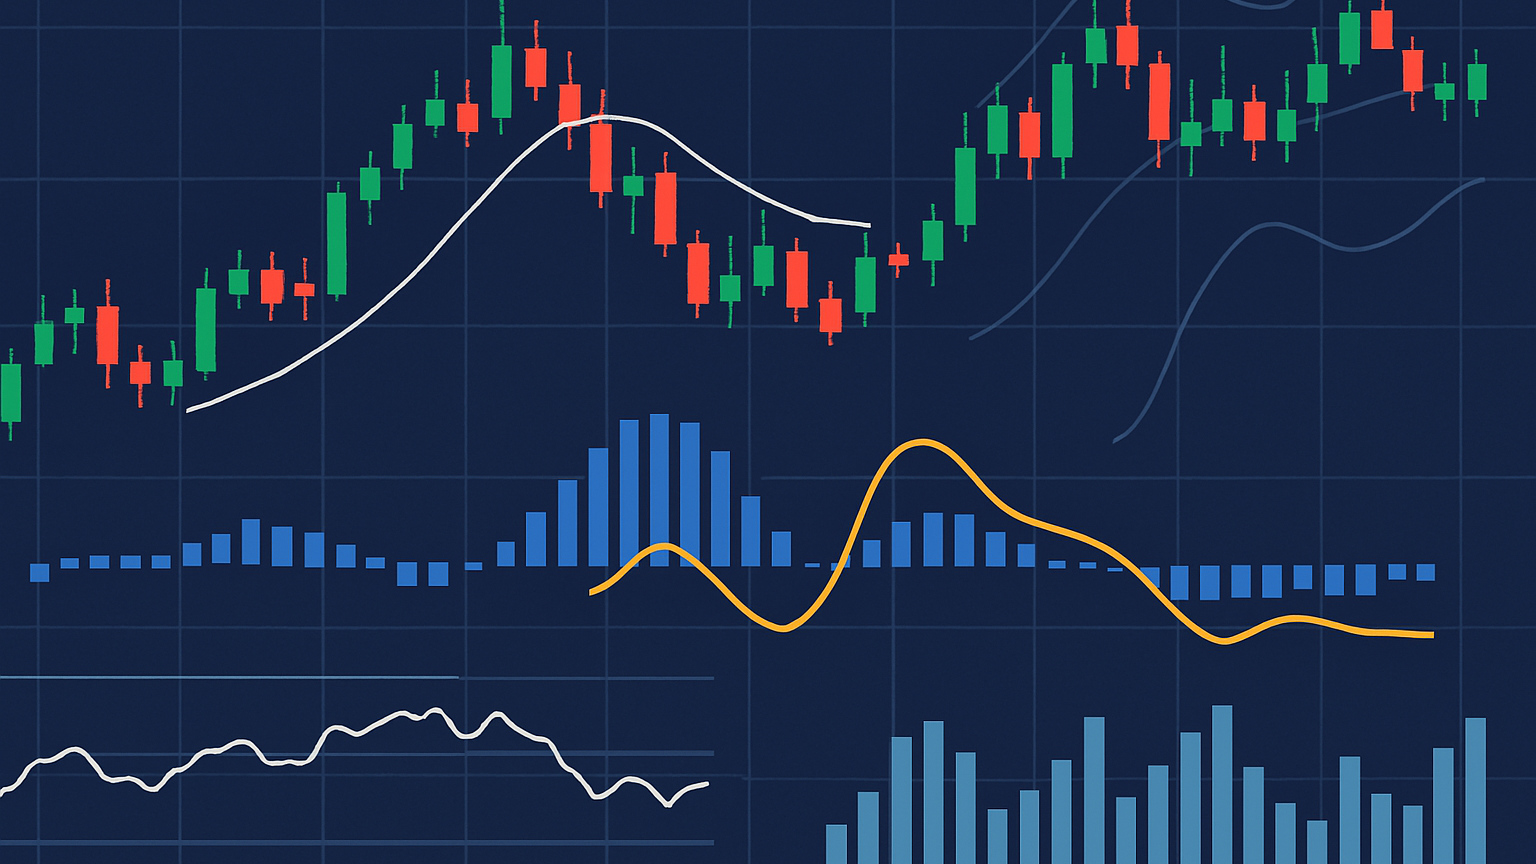
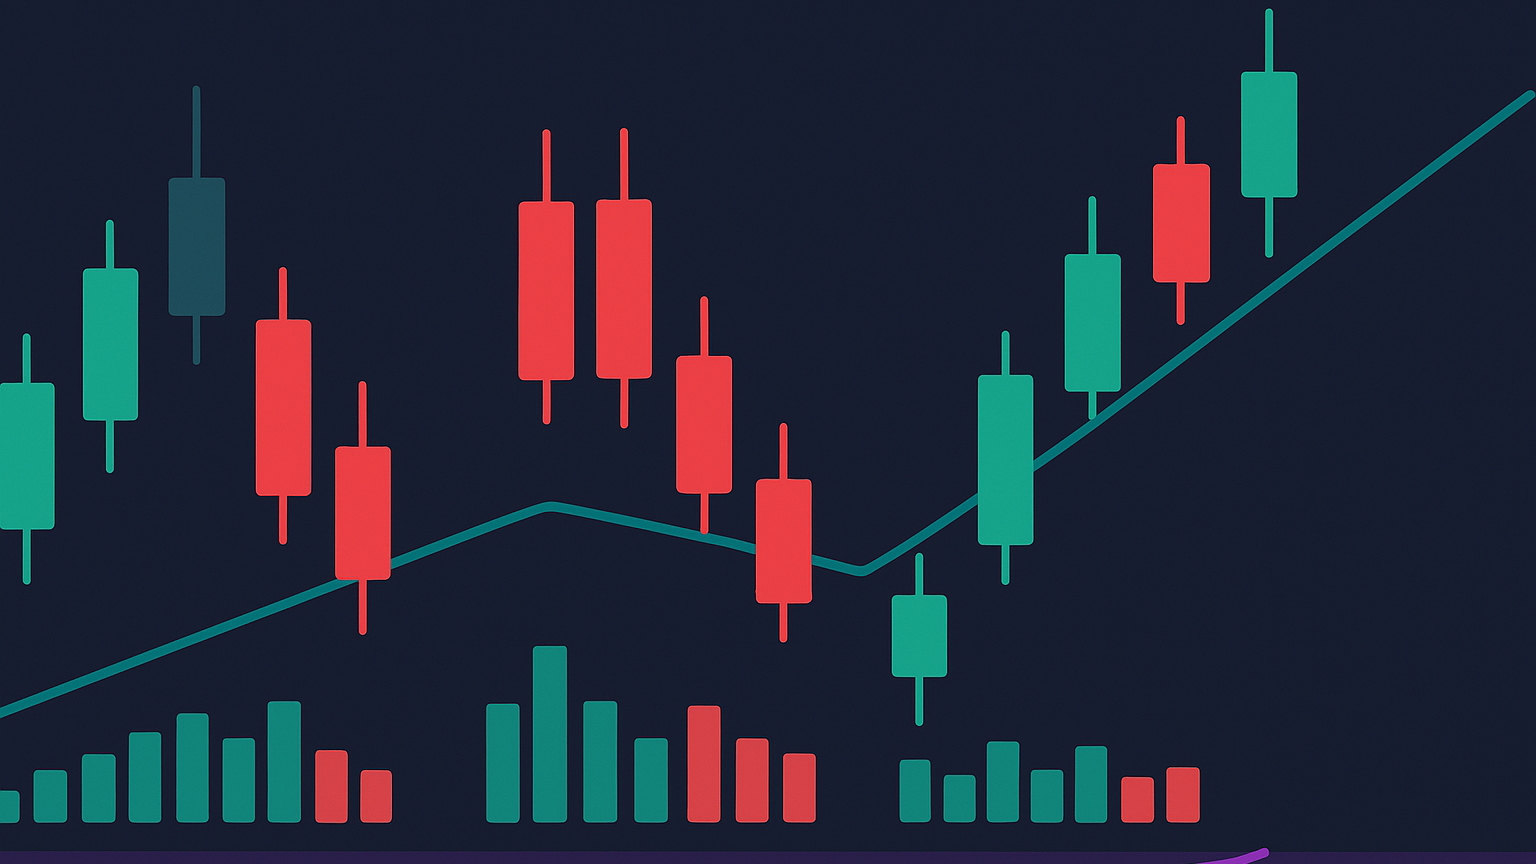
Learn how to effectively use technical indicators for market analysis, trading strategies, and avoiding common trading mistakes.
Technical indicators are tools that help traders analyze market data to make informed decisions. They transform historical price, volume, and other data into actionable insights. Here's what you need to know:
-
Types of Indicators:
- Trend Indicators: Show market direction (e.g., Moving Averages, MACD).
- Momentum Indicators: Measure price speed (e.g., RSI, Stochastic).
- Volume Indicators: Analyze trading activity (e.g., OBV, VWAP).
- Volatility Indicators: Track price fluctuations (e.g., Bollinger Bands, ATR).
-
Why Use Them?
- Spot trends and reversals.
- Make data-driven decisions.
- Manage risk with precision.
-
How to Use Them:
- Combine 2–4 indicators for better signals.
- Match indicators to your trading style (e.g., day traders use fast oscillators, long-term investors prefer trend tools).
- Test strategies on demo accounts before live trading.
-
Common Mistakes:
- Over-relying on indicators without context.
- Misreading signals due to incomplete analysis.
- Using too many indicators at once.
Pro Tip: Start simple with one indicator from each category (e.g., Moving Averages + RSI) and validate signals across multiple timeframes.
This guide simplifies technical analysis, helping you choose the right tools and avoid common pitfalls.
How to Use the RSI Indicator With MACD, Bollinger Bands and Candlestick Charts
4 Main Types of Technical Indicators
Technical indicators transform market data into actionable insights through straightforward calculations. Each category focuses on a specific aspect of market behavior.
Trend Indicators
Trend indicators help traders spot and follow the overall direction of the market. They show whether prices are heading upward, downward, or staying flat over a given period.
| Indicator | Purpose | Key Signal |
|---|---|---|
| Moving Averages | Monitor price direction | Golden/Death crosses |
| MACD | Assess trend strength | Signal line crossovers |
| Parabolic SAR | Detect trend reversals | Dots switching sides |
For instance, a golden cross in the S&P 500 marked a major shift in market direction.
Momentum Indicators
Momentum indicators focus on the speed of price changes rather than their direction. Tools like the Relative Strength Index (RSI) and Stochastic Oscillator are widely used for this purpose. Both work on a 0–100 scale, making their signals easy to interpret.
Volume Indicators
Volume indicators analyze trading activity to confirm price trends. They help traders understand if large institutional players are driving market moves.
Some popular tools include:
- On-Balance Volume (OBV): Tracks cumulative volume flow.
- Volume-Weighted Average Price (VWAP): Calculates the average price based on trading volume.
Volatility Indicators
Volatility indicators measure how much prices fluctuate, providing insight into market uncertainty. Tools like Bollinger Bands and Average True Range (ATR) are essential for adapting to shifting conditions. These indicators are especially useful during volatile periods, helping traders set stop-loss levels, anticipate price breakouts, and evaluate market sentiment.
Many successful traders rely on a combination of 2–4 different indicators to refine their strategies.
Using Technical Indicators in Trading
Building on the basics of indicator classifications, knowing how to apply them effectively is just as important.
Pairing Different Indicators
Traders often combine indicators to gain a broader understanding of market conditions. Pairing complementary tools can help confirm signals and improve decision-making.
| Indicator Pair | Purpose | Signal Confirmation |
|---|---|---|
| Moving Averages + RSI | Identifying trend direction + momentum | Validates price trend using momentum readings |
| Bollinger Bands + OBV | Assessing volatility + volume | Confirms price breakouts with volume support |
| MACD + Moving Averages | Determining trend strength + direction | Cross-checks trends across timeframes |
For example, tradeciety.com illustrates how combining RSI, ADX, and Bollinger Bands can pinpoint high-probability setups. In this setup, the ADX measures trend strength, RSI checks momentum, and Bollinger Bands outline volatility.
Limiting Indicator Count
Using too many indicators can overwhelm you and complicate your analysis. Many experienced traders stick to 2–4 indicators. To keep things simple, focus on mastering one indicator from each key category:
- Trend indicator: e.g., Moving Averages
- Momentum tool: e.g., RSI
- Volume measure: e.g., OBV
- Volatility gauge: e.g., Bollinger Bands
This streamlined approach helps you align your tools with your trading style while avoiding unnecessary complexity.
Choosing the Right Indicators
The indicators you choose should match your trading style and timeframe. For instance, day traders may prefer fast-responding oscillators, while long-term investors often lean on trend-following tools. Here’s how to find the right fit:
- Start Simple: Begin with one or two indicators in a demo account. This allows you to grasp the basics before adding more tools.
- Match Your Strategy: Use indicators that complement your trading method. Swing traders, for example, might focus on momentum oscillators, while position traders benefit from trend-based tools.
- Validate Across Timeframes: Check the same indicator over multiple timeframes to filter out false signals and find more reliable setups.
"Combining indicators that calculate different measurements based on the same price action, and then combining that information with your chart studies will very quickly have a positive effect on your trading."
- Rolf, tradeciety.com
Common Mistakes to Avoid
When working with technical indicators, it's easy to fall into common traps that can undermine your trading strategy. Even seasoned traders aren't immune to these errors. Recognizing and addressing these pitfalls can help you refine your approach.
Over-Reliance on Indicators
One of the biggest mistakes traders make is depending too heavily on technical indicators without factoring in the broader market environment. As TradingView's General Manager Pierce Crosby puts it: "Sometimes the best trade is the one you didn't make." This highlights the importance of looking beyond just the indicator signals.
| Issue | Risk | Solution |
|---|---|---|
| Focusing on One Indicator | Missing key market opportunities | Combine multiple indicators for a more complete market view |
| Sticking to Fixed Rules | Inability to adjust to market shifts | Build strategies that can adapt to changing conditions |
Misreading Signals
Incorrectly interpreting indicator signals is another common issue that can lead to costly decisions. Here are some frequent missteps:
Pattern Recognition Errors
- Acting on incomplete patterns
- Overlooking volume analysis to confirm patterns
- Ignoring historical support and resistance levels
Confirmation Challenges
For example, when using the RSI, customize its settings based on the specific asset and timeframe. Also, look for divergences that align with other indicators to strengthen your analysis.
Addressing these errors is essential for improving how effectively you use indicators in your trading.
Steps to Improve Indicator Accuracy
To get better results from your technical analysis, try these strategies:
-
Backtest Across Different Scenarios
Test your strategies in various timeframes and market conditions to ensure they're effective. Keep in mind that overfitting to historical data can lead to strategies that look great on paper but fail in live trading. -
Adapt to Market Conditions
Markets are constantly changing, and your indicators may need adjustments during volatile periods. Stay alert to these shifts and tweak your approach as needed. -
Stay Flexible but Disciplined
While it's important to adapt, always follow your trading rules. Emotional decisions driven by fear or greed can derail even the most well-thought-out strategy.
"It's not whether you're right or wrong that's important, but how much money you make when you're right and how much you lose when you're wrong." – George Soros
Keep a trading journal to track your signals, decisions, and emotions. This habit can help you identify patterns in your behavior and improve your future trades. Regular reviews through backtesting or paper trading are also invaluable for refining your strategy.
Summary and Next Steps
Now that we've covered indicator types and common mistakes, it's time to put your knowledge into action. This guide lays out a clear framework to help you get started.
Quick Reference: Indicator Types and Their Uses
Technical indicators turn raw market data into visual tools that guide trading decisions. Here's a breakdown of the four key types and how they complement each other:
| Indicator Type | Primary Function | Common Examples | Best Used For |
|---|---|---|---|
| Trend | Tracks direction and strength | Moving Averages, MACD | Identifying long-term price trends |
| Momentum | Measures price movement speed | RSI, Stochastic | Detecting overbought or oversold zones |
| Volume | Examines trading activity | OBV, A/D Line | Confirming trends |
| Volatility | Gauges price range changes | Bollinger Bands | Assessing market conditions |
Steps to Get Started
Follow these steps to kick off your technical analysis journey:
-
Define Your Trading Goals
Start by setting clear objectives and understanding your risk tolerance. This will help you choose the right indicators and shape your trading strategy. -
Focus on Core Indicators
Learn to use one or two indicators effectively before expanding your toolkit. For example, combining MACD and RSI can provide actionable signals, as shown below:Signal Type MACD Condition RSI Condition Action Buy MACD crosses above signal line RSI below 30 and moving up Enter long position Sell MACD crosses below signal line RSI above 70 and moving down Exit or short position -
Practice and Track Progress
Use a demo account to test your strategies. Record your trades to spot patterns and refine your approach over time.
Tools and Resources
To apply technical indicators effectively, consider using these platforms:
- Offers advanced charting tools starting at $18.42/month (annual plan)
- Includes custom alerts and market scanning features
- Provides a wealth of educational materials
- Provides hundreds of free trading indicators through its Library.
- Features exclusive tools and toolkits on TradingView for tailored market analysis.
- Offers an AI Backtesting platform for creating trading strategies automatically.
These platforms can help you experiment with strategies and sharpen your technical analysis skills.


