
Explore the basics of ThinkScript for Thinkorswim, enabling custom indicators and automated trading strategies tailored to your needs.
ThinkScript is a coding language built into the Thinkorswim platform by TD Ameritrade. It lets traders create custom indicators, strategies, and alerts tailored to their needs – all at no extra cost. If you’re a trader looking to enhance your analysis or automate tasks, ThinkScript is worth exploring. Here’s what you can do:
- Custom Indicators: Build tools to match your strategies.
- Integrated Analysis: Combine multiple technical indicators in one script.
- Alerts: Set notifications for specific market conditions.
- Flexibility: Adjust scripts with user inputs for personalized results.
ThinkScript is ideal for intermediate to advanced traders, especially those into technical analysis, algorithmic trading, or strategy testing. Its syntax is simple, using commands like plot(), def, and input to make coding accessible.
Quick Example:
A Moving Average Crossover script can generate buy/sell signals based on short- and long-term averages:
def shortMA = SimpleMovingAvg(close, 10);
def longMA = SimpleMovingAvg(close, 30);
plot Signal = if shortMA crosses above longMA then 1 else if shortMA crosses below longMA then -1 else 0;
ThinkScript is powerful yet easy to learn, making it a valuable asset for traders who want more control over their analysis. Ready to start? Dive into Thinkorswim and try creating your first script!
How to Create Custom Trading Indicators with thinkScript
ThinkScript Basics: Syntax and Structure
ThinkScript is designed to make creating custom trading indicators straightforward, even for those new to coding. Here's a breakdown of the key elements you need to know to get started.
Basic Code Rules
To write functional ThinkScript code, it's important to follow these syntax rules:
- Every statement ends with a semicolon (
;). - Use the
defkeyword to declare variables. - Define user inputs with the
inputkeyword. - Add comments using
#for single lines or/* */for multi-line blocks.
Here’s an example of how these rules come together:
# A simple price momentum indicator
input length = 14;  # Adjustable parameter for user
def momentum = close - close[length];
plot MomentumLine = momentum;
Key Functions and Commands
ThinkScript includes a variety of built-in functions that are essential for analyzing trading data. Here are some of the most commonly used ones:
| Function | Purpose | Example |
|---|---|---|
plot() |
Displays data on charts | plot Data = close; |
AddLabel() |
Adds labels to charts | AddLabel(yes, "Price: " + close, color.WHITE); |
crosses() |
Identifies value crossovers | def crossover = crosses(fastMA, slowMA, CrossingDirection.ABOVE); |
CompoundValue() |
Performs multi-bar calculations | def vwap = CompoundValue(1, ((high + low + close) / 3 * volume), Double.NaN); |
These functions allow you to visualize data, track signals, and calculate complex metrics directly on your charts.
Script Organization
A clear and logical script structure makes your code easier to read and maintain. Follow this recommended pattern for organizing your ThinkScript:
# 1. Input Definitions
input length = 20;
input signalType = {"Crossover", "Distance"};

# 2. Core Calculations
def fastMA = Average(close, length);
def slowMA = Average(close, length * 2);

# 3. Signal Generation
def signal = crosses(fastMA, slowMA, CrossingDirection.ABOVE);

# 4. Visualization
plot FastLine = fastMA;
plot SlowLine = slowMA;
AddLabel(yes, "Signal Active: " + signal, if signal then color.GREEN else color.GRAY);
By grouping related parts of your script – like inputs, calculations, and visual elements – you make it easier to update or expand your code later. This structured approach lays the groundwork for building more advanced trading tools, which we’ll dive into in the next section.
Building Custom Indicators
Creating custom indicators in ThinkScript involves combining variables, user inputs, and display logic to design practical trading tools. By following ThinkScript's structured approach, traders can build indicators using three main components:
Variables and User Inputs
ThinkScript relies on two essential elements for creating indicators:
input length = 14;           # Adjustable parameter
input signalLine = 80;       # Threshold value
def rsi = RSI(length);       # Calculated RSI value
def signal = rsi > signalLine;
These inputs allow you to define adjustable parameters and calculated values, making your indicators flexible.
If-Then Logic
Conditional statements let your indicators adapt to market changes:
def trend = if fastMA > slowMA then 1 else if fastMA < slowMA then -1 else 0;
You can build more complex conditions by incorporating comparison operators (e.g., >, <, ==) and logical operators (&&, ||).
Display Settings
Once your logic is in place, ThinkScript's visualization tools help you present actionable signals:
plot Signal = trend;
Signal.SetDefaultColor(GetColor(1));
Signal.SetPaintingStrategy(PaintingStrategy.LINE);
Signal.SetLineWeight(2);
Signal.AssignValueColor(
    if trend > 0 then Color.GREEN
    else if trend < 0 then Color.RED
    else Color.GRAY
);
AddLabel(yes, "Trend: " + trend,
    if trend > 0 then Color.GREEN
    else if trend < 0 then Color.RED
    else Color.GRAY
);
You can customize the display with options like:
- Line styles: solid, dashed, or dotted
- Conditional colors for better clarity
- Dynamic labels with text and color adjustments
- Various plot types: lines, histograms, or points
ThinkScript Examples
ThinkScript can be incredibly powerful when applied to practical trading scenarios. Below are some examples that illustrate its usefulness in creating custom indicators and strategies.
Moving Average Crossover Script
def shortMA = SimpleMovingAvg(close, 10);
def longMA = SimpleMovingAvg(close, 30);

def crossover = shortMA crosses above longMA;
def crossunder = shortMA crosses below longMA;

plot Signal = if crossover then 1 else if crossunder then -1 else 0;
This script generates buy signals (1) when the short-term moving average crosses above the long-term moving average and sell signals (-1) when it crosses below [5][3].
Volume Alert Script
input volumeMultiplier = 2.0;
input lookbackPeriod = 20;

def avgVolume = Average(volume, lookbackPeriod);
def volumeSpike = volume > (avgVolume * volumeMultiplier);

plot Alert = if volumeSpike then 1 else 0;
Alert.SetPaintingStrategy(PaintingStrategy.BOOLEAN_ARROW_UP);
Alert.SetLineWeight(3);
Alert.SetDefaultColor(Color.YELLOW);
This script identifies volume spikes that exceed twice the 20-day average volume, marking them with yellow arrows on the chart [4][3].
Built-in vs Custom Indicators
Custom ThinkScript indicators offer distinct benefits when compared to built-in options:
| Feature | Built-in Indicators | Custom ThinkScript |
|---|---|---|
| Flexibility | Limited parameters | Fully customizable |
| Performance | Optimized | May need tuning |
| Maintenance | Auto-updated | Requires manual updates |
| Sharing | Not shareable | Can be shared with others |
Custom scripts are especially useful for combining multiple analysis methods, as shown in the example below:
input length = 14;
input volumeThreshold = 1.5;

def rsi = RSI(length);
def volumeRatio = volume / Average(volume, length);
def signal = rsi < 30 && volumeRatio > volumeThreshold;

plot Entry = if signal then low else Double.NaN;
Entry.SetPaintingStrategy(PaintingStrategy.ARROW_UP);
This script identifies oversold conditions (RSI below 30) combined with above-average volume, offering a way to refine trading signals [5][3].
Summary
ThinkScript is a scripting language designed specifically for the Thinkorswim platform, allowing traders to create custom indicators, analyze markets, and develop trading strategies. Created by TD Ameritrade[1], it's tailored to meet the needs of traders who want personalized tools.
Key Features
ThinkScript stands out for several reasons:
| Feature | Description |
|---|---|
| Automation | Enables systematic trade execution and backtesting[4] |
Its straightforward syntax makes it approachable, even for those with minimal coding experience[2]. Unlike general-purpose programming languages, ThinkScript is built with trading in mind, offering support for everything from basic operations to advanced calculations.
Getting Started
If you're new to ThinkScript, here’s a simple way to begin:
-
Explore the Platform
Spend time learning Thinkorswim's main features to understand its full potential. -
Tap Into Resources
Check out Thinkorswim's learning center and join community forums for examples and troubleshooting tips. Start by experimenting with scripts like the Moving Average Crossover to build confidence.
These resources make ThinkScript an essential choice for traders who want more control over their analysis. For detailed examples or further guidance, refer to the script samples or FAQs provided below.
FAQs
Here are answers to some common questions about using ThinkScript on Thinkorswim:
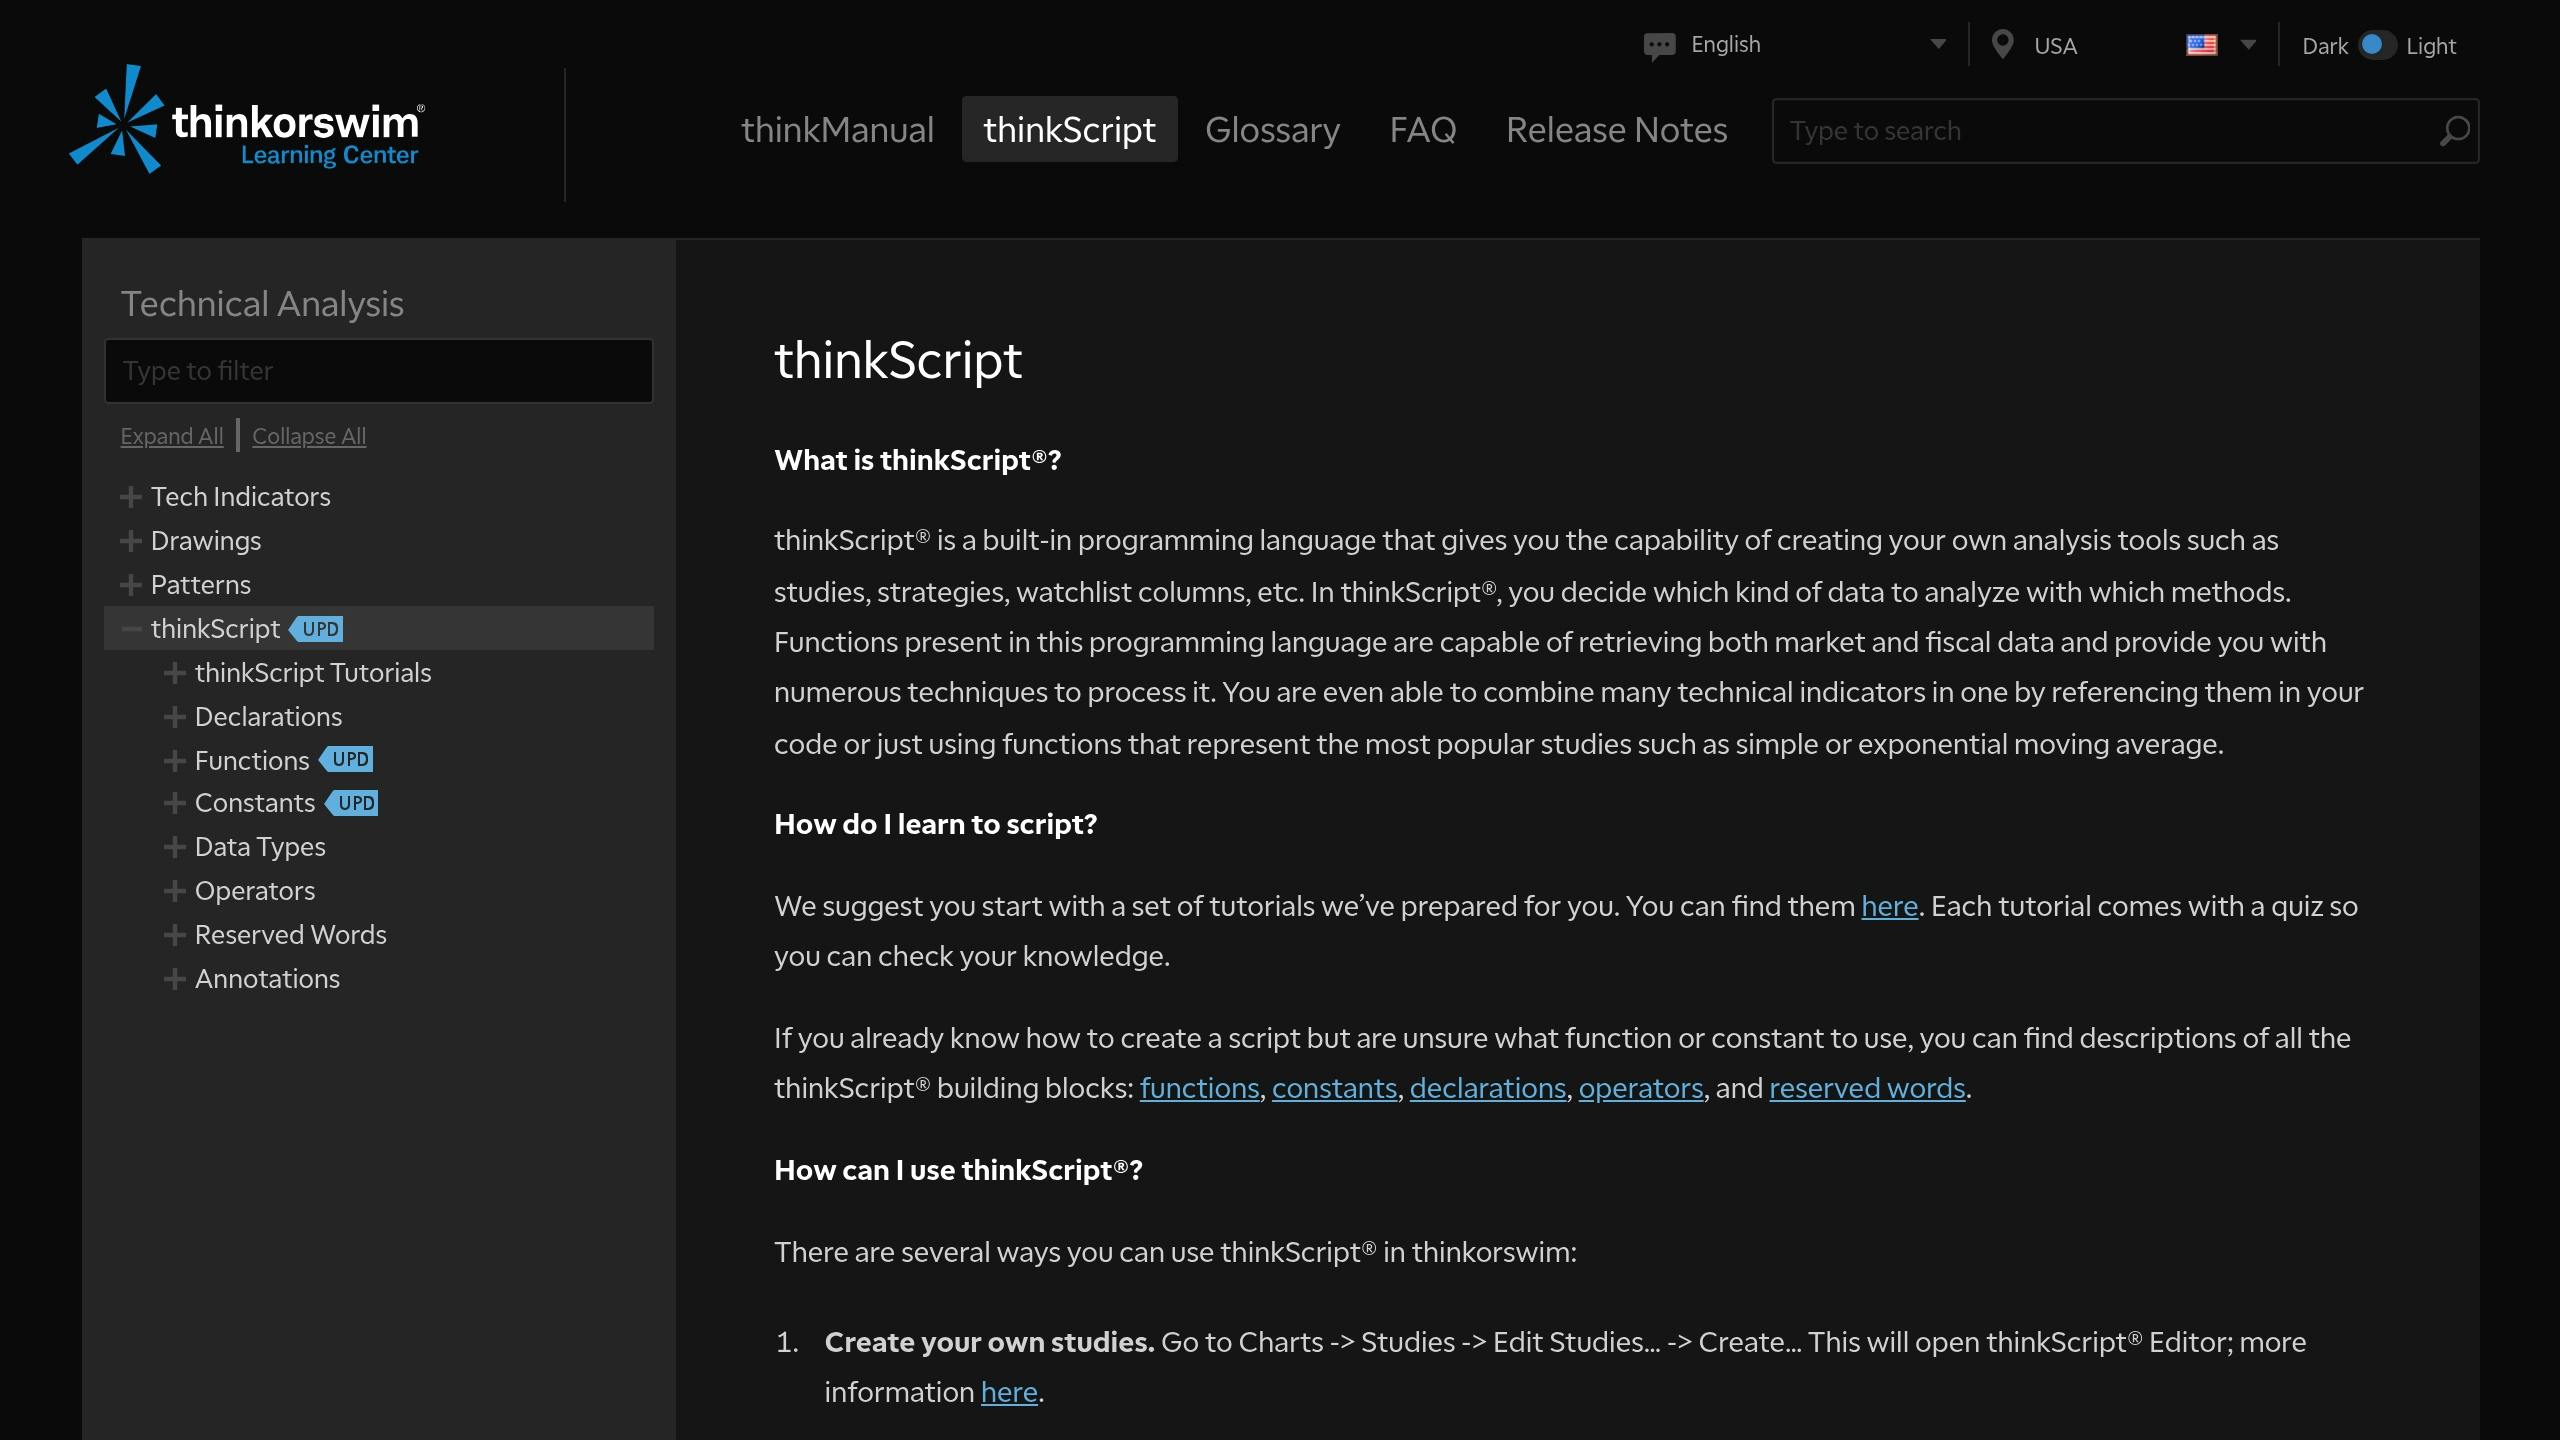
How to use thinkScript on thinkorswim?
ThinkScript can be accessed through three main features in the Thinkorswim platform:
| Usage Type | Access Method | Purpose |
|---|---|---|
| Custom Studies | Charts > Studies > Edit Studies > Create | Build personalized technical indicators |
| Data Columns | Customize Watchlist | Monitor indicator values |
What can you do with thinkScript?
ThinkScript goes beyond basic indicators, offering tools for advanced analysis and automation:
-
Technical Analysis Tools
Create indicators that combine price, volume, and volatility, or build multi-timeframe tools and custom oscillators tailored to your needs. -
Indicator-Based Automation
Develop tools for risk management or sentiment analysis to streamline your trading process.
The platform includes built-in error checking to ensure scripts run smoothly. Always test new scripts in a simulated environment to avoid potential issues during live trading.