Explore five key single-candle continuation patterns that help traders identify trend momentum and market sentiment effectively.
Single-candle continuation patterns are essential for traders to spot trend pauses and identify potential opportunities. These formations provide quick insights into market sentiment and work best when combined with complementary technical analysis methods. Here are the top five patterns covered:
- Marubozu Candle: Signals strong trend momentum with minimal wicks.
- Spinning Top: Reflects indecision during a trend, often followed by continuation.
- Doji: Indicates a pause in momentum, requiring confirmation for trend continuation.
- Long-Legged Doji: Highlights heightened indecision with long shadows.
- High Wave Candle: Shows volatility within a trend, signaling potential continuation.
Quick Comparison
| Pattern | Key Feature | Signal | Confirmation Needed? |
|---|---|---|---|
| Marubozu | Long body, no wicks | Strong trend continuation | Yes |
| Spinning Top | Small body, equal-length shadows | Temporary indecision | Yes |
| Doji | Tiny/no body, varying shadows | Pause in momentum | Yes |
| Long-Legged Doji | Long shadows, small body | Intense market uncertainty | Yes |
| High Wave Candle | Small body, long shadows, volatility | Trend continuation with swings | Yes |
Use these patterns with volume analysis and stop-loss strategies for better trading outcomes. Pair them with the comprehensive range of advanced trading indicators and exclusive features available on TradingView via LuxAlgo to simplify detection and validation. Always ensure confirmation before acting on these patterns.
1. Marubozu Candle: A Strong Trend Signal
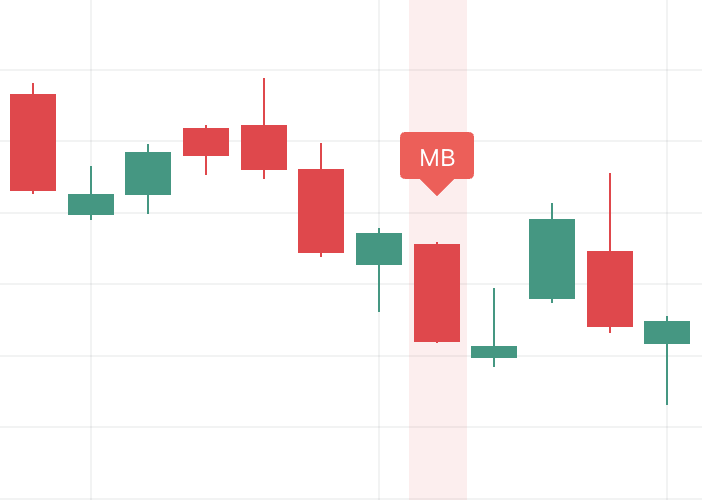
The Marubozu candle is one of the clearest single-candle formations in technical analysis, often pointing to strong market momentum. Its defining feature is a long body with little to no wicks on either end, making it a prime signal for trend continuation.
Key Features
- A long body that dominates the trading session's range.
- Minimal or no upper and lower shadows, with the close near the session's high (bullish) or low (bearish).
Types of Marubozu
- Bullish Marubozu: Typically green or white, showing strong buying pressure.
- Bearish Marubozu: Often red or black, signaling strong selling pressure.
How to Use It in Trading
Spotting a Marubozu candle in line with the current trend often indicates a strong continuation. This formation is highly valued for confirming trend persistence. The advanced trading indicators available on TradingView via LuxAlgo can simplify this process by automatically identifying Marubozu candles across different timeframes, helping traders pinpoint opportunities more efficiently.
Things to Keep in Mind
While the Marubozu signals clear momentum, always consider the bigger picture:
- Ensure it aligns with the overall trend.
- Check if trading volume supports the momentum.
- Use additional technical indicators to confirm the scenario.
Even reliable patterns like the Marubozu can fail, so always apply risk management strategies to protect your trades.
While the Marubozu signals strong momentum, contrasting formations like the Spinning Top highlight moments of indecision within trends.
2. Spinning Top: Indecision in a Trend
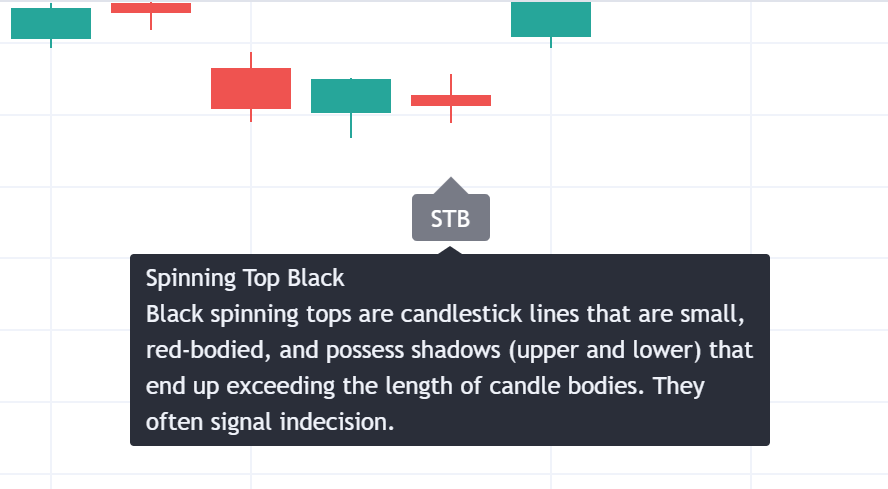
The Spinning Top candlestick shows a moment of uncertainty in the market, often appearing within established trends. It usually signals a temporary pause before the trend continues. This pattern is characterized by a small real body—bullish or bearish—near the middle of the trading range, with long upper and lower shadows of roughly equal length. During these sessions, both buyers and sellers are active, but neither gains control, resulting in nearly equal opening and closing prices that indicate market balance.
Trading Applications
When a Spinning Top appears during a strong trend, it often points to a brief consolidation rather than an immediate reversal. Traders can use this pattern to recognize periods of sideways movement and assess whether the trend's momentum is weakening, especially when multiple Spinning Tops occur in succession.
Using Technical Tools
The advanced trading indicators available on TradingView via LuxAlgo can make spotting and interpreting Spinning Top patterns easier. Additionally, the Price Action Concepts toolkit provided by LuxAlgo can automatically highlight these formations and supply extra context through features like volume analysis and trend indicators.
Risk Management
To trade wisely with Spinning Tops, consider the following:
- Avoid relying solely on this pattern to make decisions.
- Take into account the broader market environment.
- Seek confirmation from subsequent candles.
- Use proper position sizing and set stop-loss levels to manage risk.
While Spinning Tops reflect indecision, the Doji pattern illustrates a more pronounced pause in market momentum.
3. Doji: A Pause in Market Momentum
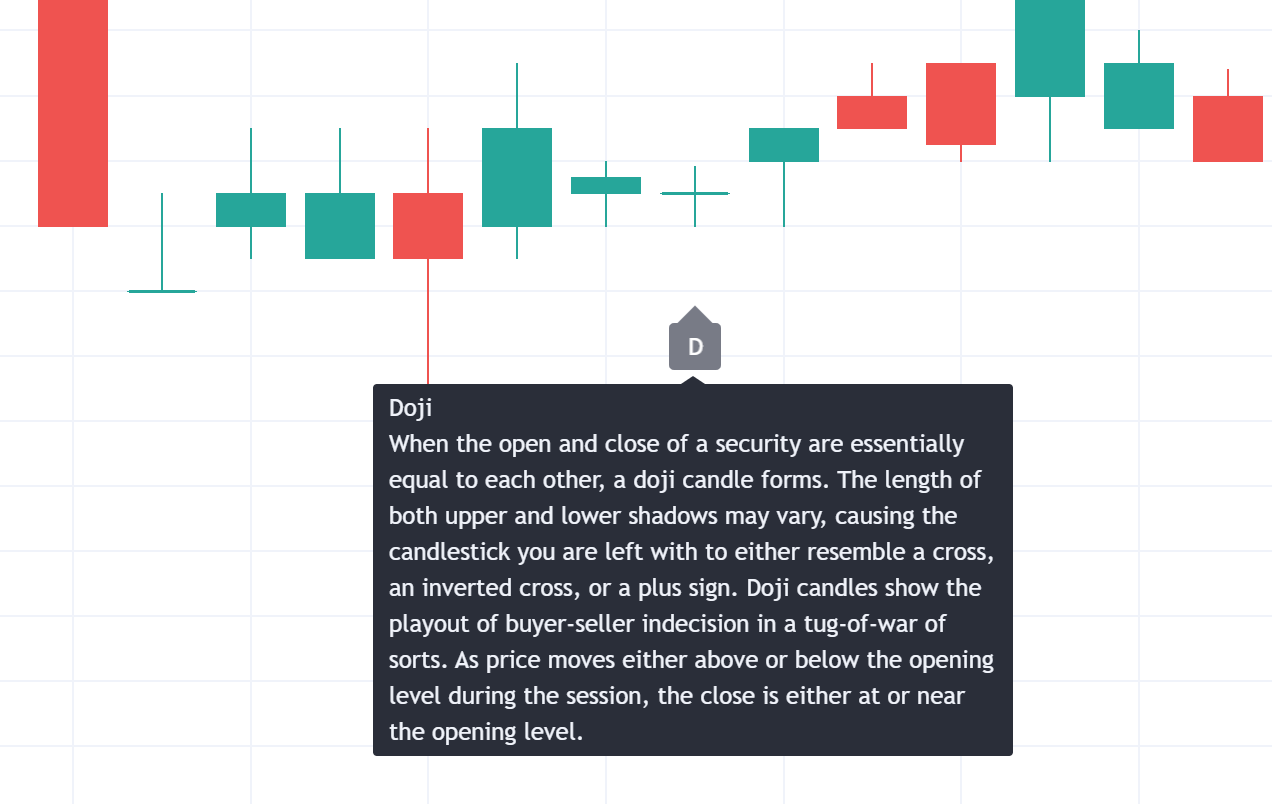
The Doji candlestick formation is notable for its tiny or non-existent real body and varying shadow lengths. It reflects a moment of balance between buyers and sellers, with nearly identical opening and closing prices.
Key Characteristics
Here’s what makes a Doji unique:
- A minimal or missing real body
- Upper and lower shadows that differ in length
- Often signals a temporary pause when it appears during a trend
Trading Context
In technical analysis, a Doji serves as a checkpoint within a trend. It helps traders evaluate the likelihood of a trend's continuation. For instance, in an uptrend, a Doji followed by a strong bullish candle can confirm the resumption of upward momentum.
Interpretation Guidelines
| Aspect | Trading Implication |
|---|---|
| Shadow Length & Volume | Reflects market volatility and signal strength |
| Position in Trend | Affects the likelihood of trend continuation |
Risk Management
When trading Doji patterns, factor in support and resistance levels, overall market conditions, and trend strength. The Price Action Concepts toolkit provided by LuxAlgo can simplify this process by automatically identifying and validating Doji patterns.
Pattern Validation
To confirm a Doji pattern, wait for a strong candle in the trend’s direction after the Doji appears. This approach helps filter out false signals, especially near key price levels or during robust trends.
While the Doji signals a brief pause, the Long-Legged Doji takes this concept further by highlighting heightened indecision and a more intense struggle between buyers and sellers.
4. Long-Legged Doji: A Battle Between Buyers and Sellers
The Long-Legged Doji stands out with its long shadows and small real body, capturing a moment of significant market uncertainty. It reflects vigorous price movements in both directions, indicating a tug-of-war between buyers and sellers. This formation often appears during strong trends and can suggest a pause before the trend resumes, particularly when trading volume is high.
Its typically larger size compared to other Doji patterns underscores the elevated volatility and active market participation during its formation.
Trading Application
To make the most of the Long-Legged Doji as a continuation signal, keep these points in mind:
- Pattern Location: Most impactful during strong uptrends or downtrends.
- Volume Analysis: Higher trading volume reinforces the pattern's significance.
- Confirmation: Wait for the next candle to break above or below the Doji's range before acting.
Risk Management Strategy
Implement careful risk management when trading this pattern. For instance, in an uptrend:
- Entry Point: Place your entry above the Doji's high.
- Stop Loss: Set your stop loss below the Doji's low.
- Target: Use the average movement distance of the preceding trend to set your target.
Traders using the comprehensive range of advanced trading indicators and features available on TradingView via LuxAlgo to identify and validate such patterns have successfully captured trend continuations in real time.
Key tips include:
- Assess the broader market conditions before entering a trade.
- Wait for confirmation to avoid false signals.
- Align trades with the prevailing trend direction.
- Factor in the pattern's volatility when setting stop-loss levels.
While the Long-Legged Doji signals a period of uncertainty, the High Wave Candle takes the concept of volatility to an even greater scale.
5. High Wave Candle: Volatility Within a Trend
The High Wave Candle is a single-candle continuation pattern that highlights market volatility while suggesting trend continuation. It features a small real body positioned near the center of the candle, accompanied by long upper and lower shadows.
Key Characteristics
| Feature | Description |
|---|---|
| Body and Shadows | Small body (less than 20% of the candle's total length) with long shadows (at least twice the body size) |
| Pattern Size | Often larger than the last 20 candles, indicating its market influence |
| Location | Typically appears at key support or resistance levels |
How to Trade the High Wave Candle
- Spot the Pattern: Identify this candle at crucial support or resistance levels.
- Confirm Volume: High trading volume strengthens the pattern’s reliability.
- Entry Point: Enter trades once the candle’s range is broken in the direction of the trend.
Risk Management Tips
- Stop Loss: Place your stop loss just beyond the opposite end of the candle from your entry.
- Position Sizing: Adjust trade size to account for the pattern’s inherent volatility.
- Wait for Confirmation: Ensure the subsequent candle supports the continuation before committing.
Practical Use in Trading
The High Wave Candle is especially useful for traders seeking to capitalize on trend continuations during volatile periods. Despite large price swings, the pattern indicates that the primary trend remains intact. LuxAlgo’s advanced trading indicators on TradingView, including the Price Action Concepts toolkit, analyze volume profiles and trend strength to validate the pattern and highlight high-potential setups.
Using Tools to Analyze Candle Patterns
After understanding the key single-candle continuation patterns, it’s important to explore how modern analysis features simplify their detection and evaluation. Advanced trading indicators now enable traders to quickly spot and assess these patterns with greater precision.
Pattern Detection and Validation
The Price Action Concepts (PAC) toolkit provided by LuxAlgo simplifies the detection of single-candle continuation patterns with its advanced capabilities. It identifies key formations in real time, allowing traders to act more efficiently.
| Feature | Purpose |
|---|---|
| Smart Pattern Detection | Automatically spots patterns within the context of the trend, minimizing false signals |
| Volume Integration | Confirms pattern strength by analyzing trading volume alongside trend alignment |
Advanced Analysis Tools
The advanced trading indicators available on TradingView via LuxAlgo offer customizable alerts and detailed analytics, empowering traders to set personalized notifications and monitor critical metrics like trend strength and volatility.
"LuxAlgo aims to provide intuitive, customizable indicators that help traders make informed decisions with confidence."
Tools for Testing and Validation
In addition, LuxAlgo features backtesting capabilities that allow traders to evaluate pattern-based strategies across various market conditions. Patterns are ranked by reliability, enabling traders to prioritize setups with higher success rates.
All-in-One Trading Environment
LuxAlgo integrates a comprehensive range of features on TradingView, including:
- Real-time pattern recognition
- Customizable indicator overlays
- Advanced charting tools
- Alerts based on specific patterns
These features work in unison to create a seamless trading experience, helping traders stay ahead in dynamic markets.
Conclusion
Single-candle continuation patterns offer valuable insights for traders looking to identify and act on market trends. By exploring five key patterns – Marubozu, Spinning Top, Doji, Long-Legged Doji, and High Wave Candle – this article highlights how these formations can reveal market sentiment and potential price shifts.
Key Points for Traders
Effectively using these patterns involves combining them with robust analysis and sound risk management. Research indicates that many candlestick formations can outperform broader market benchmarks, underlining their potential.
Advanced Features for Confirmation
The advanced trading indicators and exclusive features available on TradingView via LuxAlgo simplify pattern recognition with real-time detection, volume integration, and risk management tools. These capabilities help traders focus on setups with higher probabilities of success.
Risk Management Tips
Effective risk management practices include:
- Matching position sizes to your risk tolerance
- Placing stop-loss orders strategically
- Confirming signals across multiple timeframes
- Using volume analysis to validate patterns
FAQs
What is the trend continuation candle pattern?
A trend continuation candle pattern is a candlestick formation that suggests the current trend is likely to resume after a brief pause. These formations typically appear within established trends and help traders identify opportunities to follow the prevailing market direction.
| Aspect | Description |
|---|---|
| Pattern Context | Found within trends, signaling continuation after brief consolidation |
| Validation Requirements | Needs confirmation through volume analysis and appropriate market positioning |
| Historical Performance | Often reliable when validated under the right conditions |
The advanced trading indicators available on TradingView via LuxAlgo make analyzing continuation patterns easier by offering:
- Real-time detection across multiple timeframes
- Built-in volume analysis to confirm patterns
- Automated assessments of trend strength
- Reliability scoring based on market conditions
Key Trading Tips:
- Ensure a strong trend is already in place before acting on these patterns.
- Validate patterns using volume analysis and their position within the overall market context.
- Employ additional technical indicators to confirm signals before making decisions.
Single-candle continuation patterns can be powerful indicators in trending markets, especially when supported by advanced analysis features.