Top 5 Technical Indicators for Forex Market Analysis
Moving averages, RSI, Bollinger Bands, MACD and OBV describe different aspects of a forex chart: trend, momentum, volatility and a volume-based proxy. They are useful tools to understand, but there is no universally most accurate indicator or combination. Their value depends on the rules, data, costs and market conditions being evaluated.
This guide explains what each indicator calculates, how traders interpret it and which assumptions need care. For forex, the volume input deserves particular attention: a feed’s tick count is not the total amount traded across the currency market.
Compare the Five Indicators
| Indicator | What it measures | Common reference | Main limitation |
|---|---|---|---|
| Moving averages | A smoothed price series | SMA or EMA over a chosen number of bars | Lag and repeated crossings in sideways conditions |
| RSI | Smoothed gains relative to smoothed losses | 14 periods; 30, 50 and 70 reference levels | An extreme can persist and is not an automatic reversal |
| Bollinger Bands | Price relative to a moving average and dispersion | 20-period SMA with bands two standard deviations away | A squeeze does not specify breakout direction or timing |
| MACD | The difference between two moving averages | 12/26 EMAs and a 9-period signal | Price-scaled and closely related to other average-based signals |
| OBV | Cumulative volume signed by close-to-close direction | Add, subtract or carry forward the bar’s volume | The volume source limits what the result can mean |
1. Moving Averages: Define the Trend Rule
A simple moving average adds the chosen prices over a window and divides by the number of observations. An exponential moving average weights recent observations more heavily. A conventional EMA uses a smoothing factor of 2 divided by the period length plus 1; initialization and the price source still need to be specified.
An EMA can respond faster than an SMA of the same nominal length, but faster is not automatically better for short-term trading. It can also react more frequently to noise. Both summarize information already observed and can lag a changing market.
Periods Are Bars, Not Trading Styles
A 10-period average on a daily chart uses ten daily bars. On a five-minute chart it uses ten five-minute bars. Calling a 10-day average a day-trading setting confuses the calculation window with the holding period. A daily average can provide intraday context, but that is a separate rule.
Lengths such as 10–20, 50 and 200 are common comparison points. They do not divide neatly into mandatory day, swing and position-trading settings. Fix the interval, lookback and holding-period hypothesis before choosing parameters.
A fast average crossing above a slow one establishes the relationship between those averages at that moment. It does not prove that a lasting uptrend has begun. Crossovers can repeatedly reverse in a range. Price interactions with an average can also be researched as possible support or resistance, but the calculated line is not an order-book barrier.
2. RSI: Read Momentum Without Assuming a Reversal
Wilder’s relative strength index compares smoothed positive price changes with smoothed negative changes, usually over 14 periods. With positive smoothed losses, its standard form is 100 − 100 ÷ (1 + smoothed gains ÷ smoothed losses). Implementations need defined behavior when losses or both components are zero.
| RSI reference | What it describes | What it does not establish |
|---|---|---|
| Above 70 | A conventional overbought reading | That price must fall or that a short entry is justified |
| Below 30 | A conventional oversold reading | That price must rise or that a long entry is justified |
| Around 50 | Similar smoothed gains and losses under the calculation | The strength or durability of a future trend |
| Price/RSI divergence | Selected price and oscillator swings disagree | A guaranteed reversal or an immediately available entry |
RSI can remain high during an advance and low during a decline. A recovery above 30 or a move back below 70 can be part of an entry hypothesis, but it still needs an explicit candle-close rule, exit and evaluation. Changing the length changes the series; it does not simply increase accuracy.
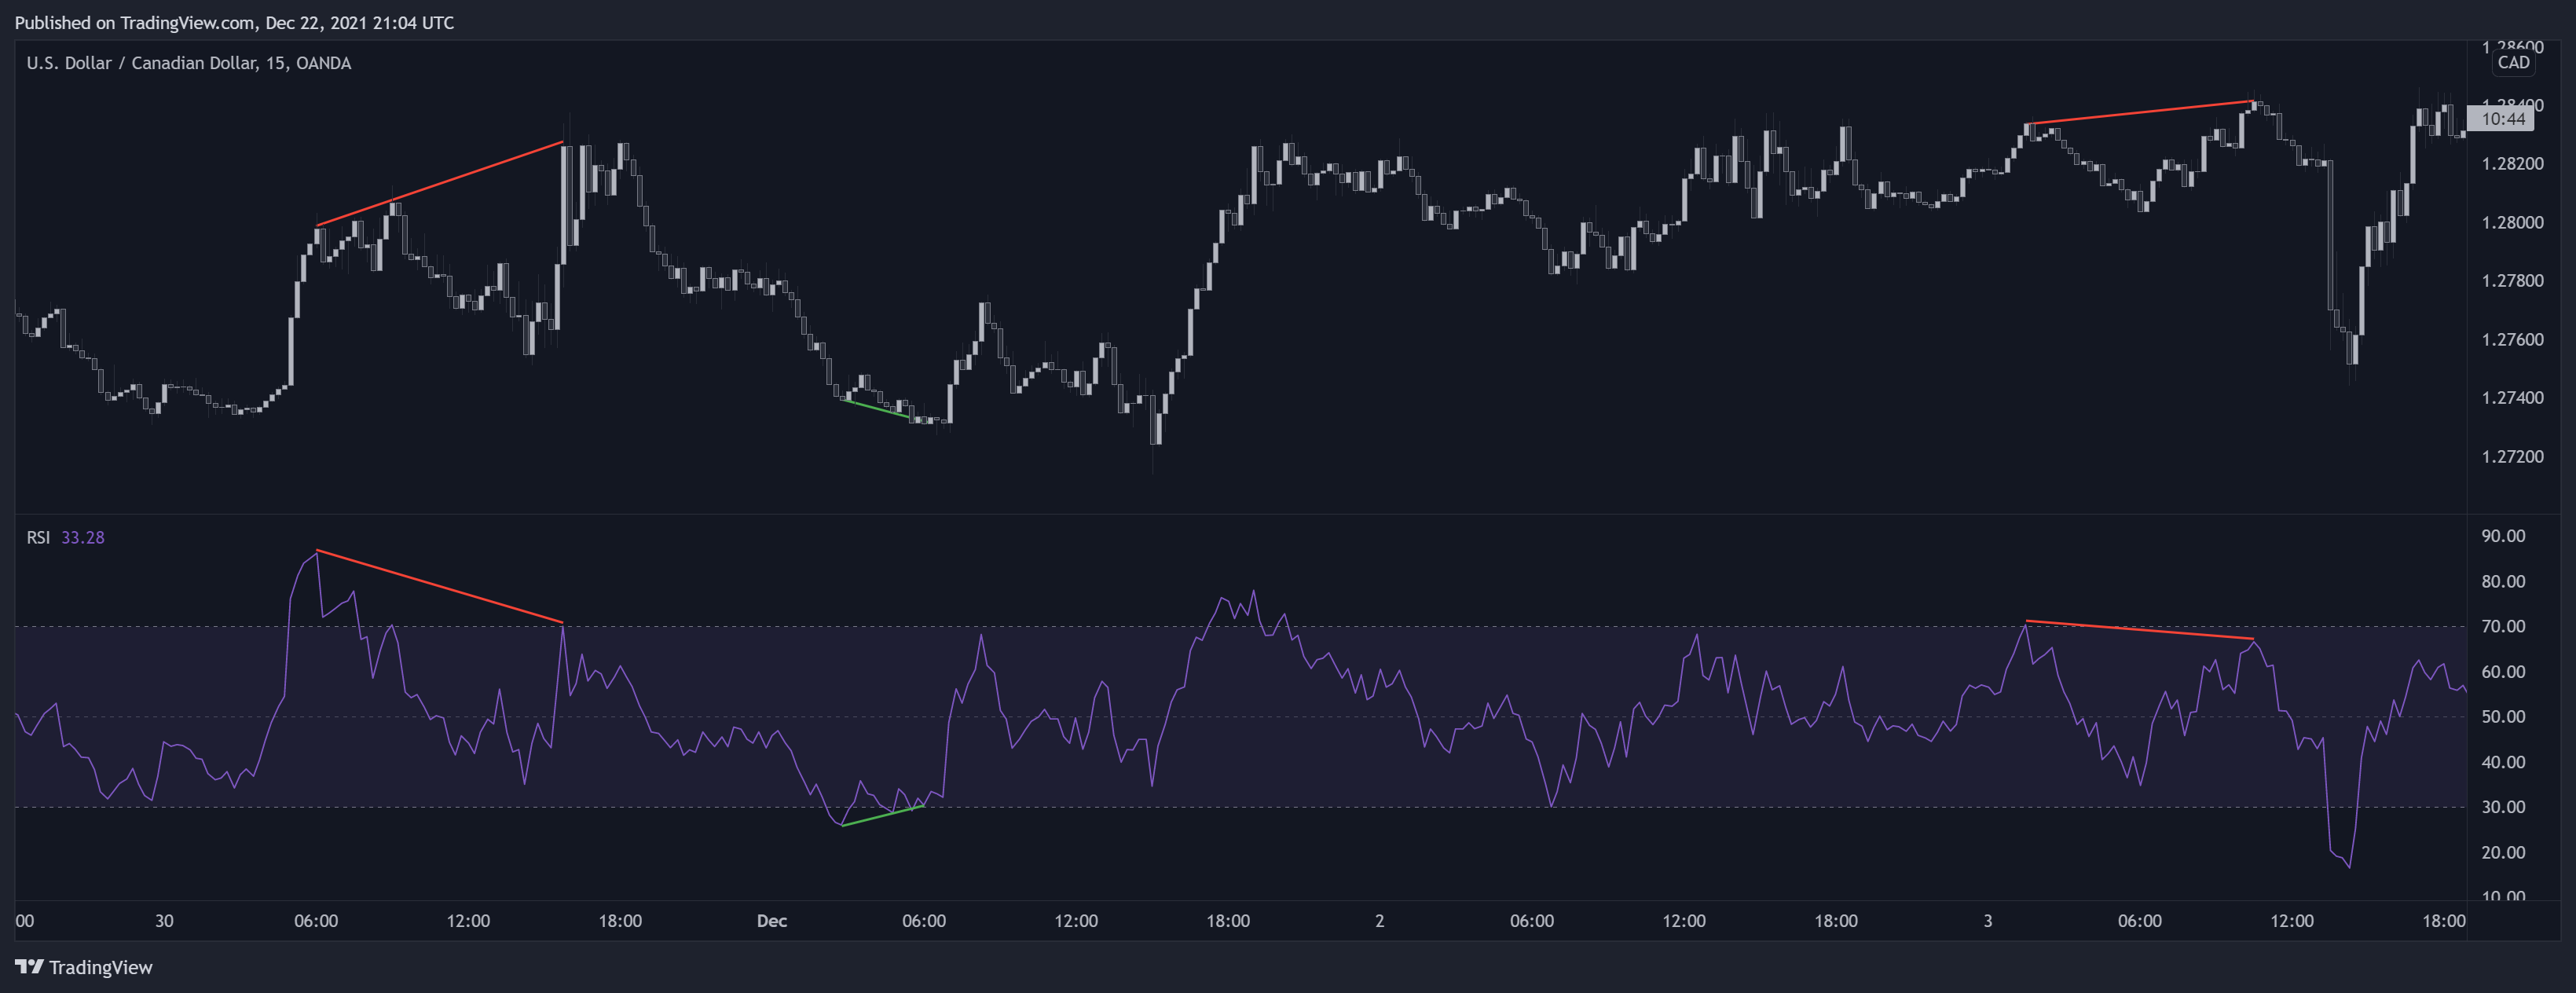
For divergence, specify which swings you compare and whether their identification requires later bars. A historical pivot drawn back at an earlier candle cannot be used as though it were known then. The detailed RSI guide explains smoothing choices and related oscillator constructions.
3. Bollinger Bands: Volatility Without a Direction Forecast
Traditional Bollinger Bands use a 20-period simple moving average and upper and lower bands two standard deviations from that average. These are conventional defaults. The middle series describes the price center over that window; the distance to the bands reflects the dispersion used in the calculation.
A contraction, often called a squeeze, identifies relatively narrow bands. It does not tell you when volatility will expand or whether the next move will be up or down. Wider bands describe greater dispersion; they do not necessarily mean greater traded volume or more participants.
John Bollinger’s published rules distinguish touching a band from receiving a trading signal. Price can keep moving along an outer band in a trend. A close outside can be investigated as continuation, but no close-based filter removes every failed breakout.
Do not assume that two standard deviations guarantee 95% future price containment. Band settings and market distributions do not justify that shortcut. A mean-reversion rule and a volatility-breakout rule can interpret the same band interaction differently, so test them as separate hypotheses.
Pairing bands with RSI can organize a momentum-and-dispersion question. It does not guarantee better accuracy: both depend on the same price history. Select settings using a development sample and check the unchanged rules on later data instead of continually adjusting them to explain the latest move.
4. MACD: Separate the Signal Cross from the Zero Cross
The conventional MACD calculation subtracts the 26-period EMA from the 12-period EMA. A 9-period EMA of that difference forms the signal line, and the histogram is MACD minus its signal. Some platform versions use different smoothing, so compare the actual implementation.
- Above or below zero: the fast EMA is above or below the slow EMA. This is not the same event as crossing the signal line.
- A signal-line crossover: the MACD series moves through its own smoothed reference. It can occur while MACD remains on either side of zero.
- A shrinking histogram: MACD and its signal are getting closer. Price can still move in its existing direction.
- Divergence: selected price and MACD turns differ. Define the swings and the additional entry condition rather than treating the divergence as a complete trade.
MACD is expressed in price units. Its numerical size is not directly comparable between EUR/USD and USD/JPY as a universal trend-strength score. Shorter settings are more responsive but may produce more crossings; standard 12/26/9 settings are not restricted to daily charts or guaranteed to suit a particular pair.
Combining MACD with another moving-average crossover can duplicate closely related information. Adding RSI gives another momentum view, but it is still not independent evidence that a trade will work. Compare a simple rule with each added condition.
5. OBV: Check the Forex Volume Input First
The OBV calculation adds the full bar volume when the close rises from the prior close, subtracts it when the close falls, and leaves the running total unchanged when the closes are equal. The direction of the close signs the entire volume; OBV does not identify which trades were buyer- or seller-initiated.
Suppose OBV starts at zero. An up-close with volume 120 takes it to 120; a down-close with volume 80 takes it to 40; an unchanged close with volume 60 leaves it at 40. These are arbitrary example units. A very small up-close still adds the whole 120, which shows how coarse the assignment is.
Tick Counts Are Not Market-Wide Traded Quantity
MetaTrader’s official volume documentation describes forex volume as the number of price changes within a bar, distinguishing it from actually traded quantities. Verify the specific broker, symbol and selected volume field; do not assume all feeds supply the same measurement.
An OBV series built from tick counts is therefore a cumulative, direction-signed activity proxy for that feed. It is not a consolidated record of global forex turnover, institutional positions or hidden accumulation. Currency-futures exchange volume is another measurement with its own contract and venue; it is not interchangeable with spot tick volume.
The raw OBV total depends on its starting point and available history. Standard OBV has no required short or long lookback setting like an RSI length. Changing the chart interval, adding smoothing or defining a divergence window changes the analysis, but those are separate choices. Missing or unusable volume should lead you to omit the volume condition, not present it as validated.
Traders may compare OBV swings with price or investigate an OBV move during price consolidation. Those observations are hypotheses to test. A disagreement does not guarantee reversal, and a rising line does not reveal the identity or motives of the participants.
Combine Indicators Around One Testable Question
| Style or question | Example to investigate | What to control |
|---|---|---|
| Intraday trend context | A moving-average condition plus an RSI entry rule | Bar interval, completed signals, spread, session and rapid whipsaws |
| Volatility expansion | A band-contraction rule followed by a defined breakout | Lookback, breakout distance, failed moves and fill timing |
| Swing analysis | A price trend with an optional OBV comparison | Volume definition, source consistency and later-period results |
| Longer-horizon context | A longer average with a MACD or RSI condition | Duplicated information, holding costs and drawdown |
These are examples, not a ranking of the best combinations. Start with a simple entry and exit rule, then measure the effect of adding one filter. Keep losing trades, missed fills and out-of-sample periods. Changing several settings after each loss can fit the past without improving a future decision.
Indicator agreement is not risk management. Define position size, adverse exit, target or time exit, and maximum exposure separately. For forex, include bid/ask differences, spread changes, commissions, overnight financing and realistic slippage. News releases and session changes can alter both prices and execution conditions.
Research the Rules in LuxAlgo’s Native Platform
Use the current Library and native chart workflow to inspect supported implementations. Keep the pair, source, chart interval and formula settings consistent across comparisons. A chart illustration explains a calculation; it does not substitute for evaluating a complete strategy.
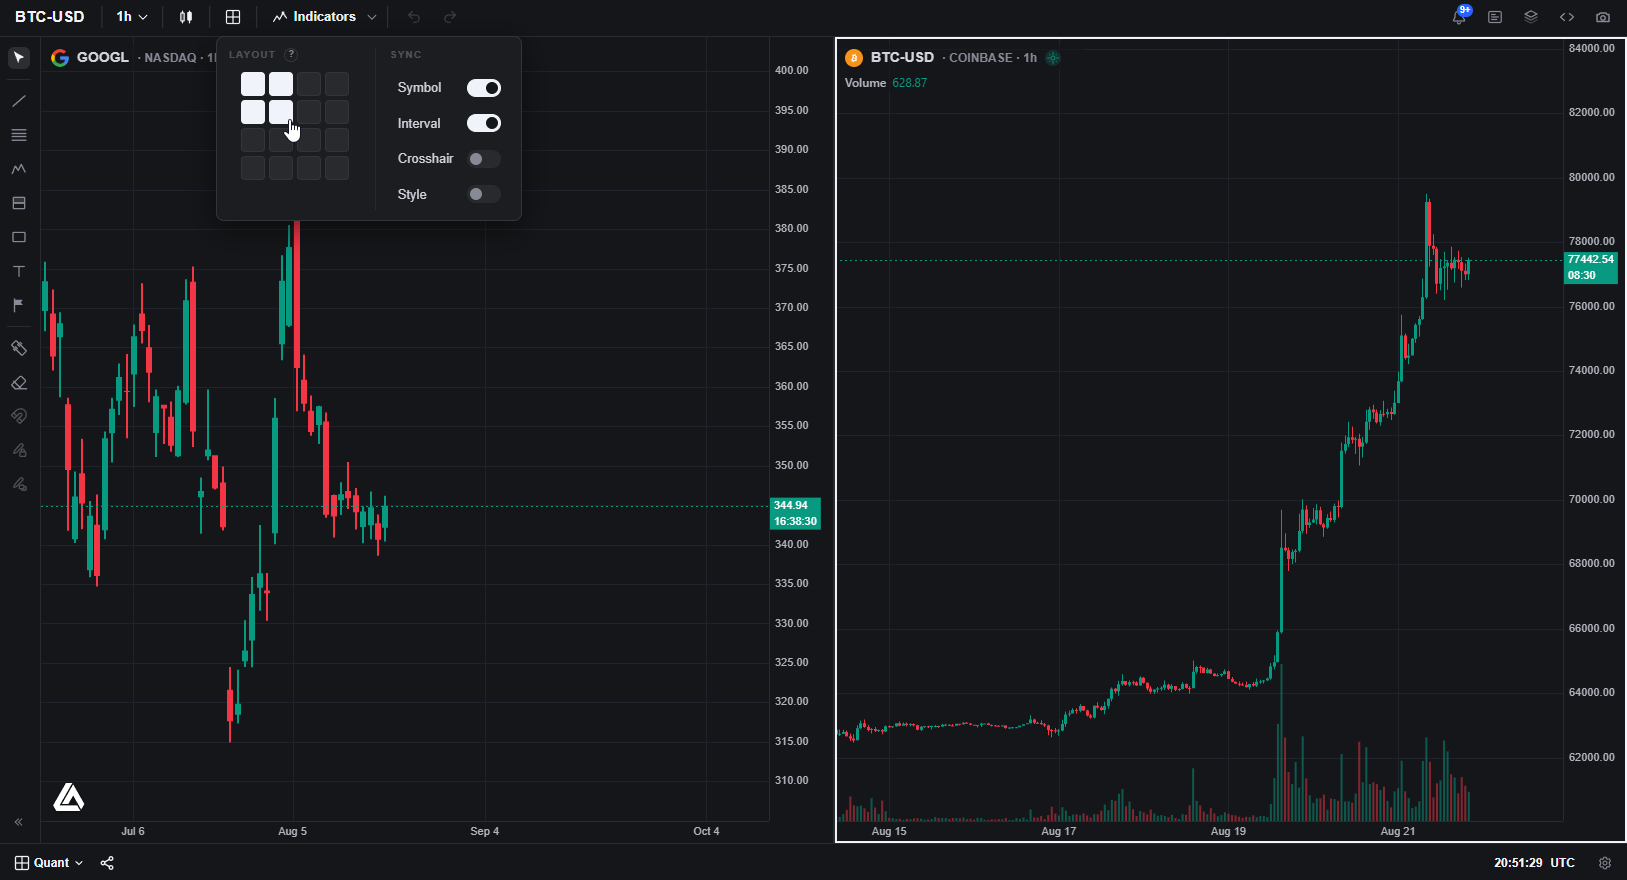
Ask Quant, our coding agent to express a supported strategy hypothesis, including the exact entry, exits and costs. Inspect the generated code and run it manually. Review strategy settings and individual trades on standard candle prices, then evaluate a later period not used for tuning.
Check native data coverage before assuming a forex symbol supports the same volume analytics as another market. The TradingView toolkit workflow and legacy Backtesting Assistant are separate from the current native workflow.
Frequently Asked Questions
What is the most accurate indicator for forex?
There is no universal answer. Compare explicitly defined rules on the intended pair, source, interval and later data after costs; an indicator name alone does not establish accuracy.
Does RSI below 30 mean buy?
No. It is a conventional oversold reading under the chosen calculation. It can persist during a decline and needs a separate entry, exit and risk framework.
Does a Bollinger squeeze predict breakout direction?
No. It describes narrow bands relative to the selected calculation. Direction, timing and a trading rule require separate conditions.
Can OBV reveal institutional forex buying?
No. OBV signs each bar’s entire volume by close direction. On tick-count feeds it is an activity proxy, not a record of institutional orders or global traded quantity.
Is a 10-period average always a day-trading setting?
No. Periods refer to chart bars. Ten daily bars and ten five-minute bars are different windows, and the appropriate use depends on the strategy being evaluated.
Read next