
Explore essential bearish reversal patterns that signal potential market declines, helping traders manage risks effectively.
In trading, bearish reversal patterns help identify when an uptrend might turn into a downtrend. These patterns signal selling pressure overtaking buying momentum, allowing traders to anticipate market declines and manage risks. Here’s a quick overview of the 7 key patterns:
- Bearish Engulfing: A large bearish candle engulfs a smaller bullish one, signaling a shift to seller dominance.
- Dark Cloud Cover: A bearish candle closes below the midpoint of a prior bullish candle, showing selling pressure.
- Evening Star: A three-candle pattern marking a trend reversal with a small-bodied candle followed by a strong bearish one.
- Shooting Star: A single candle with a long upper shadow, indicating a rejection of higher prices.
- Bearish Harami: A smaller bearish candle forms within the body of a preceding bullish one, hinting at waning buyer strength.
- Three Black Crows: Three consecutive bearish candles signal persistent selling pressure.
- Abandoned Baby: A three-candle pattern with a "gap" highlighting a sharp reversal in sentiment.
Quick Tip: Always confirm these patterns with additional tools like volume analysis, RSI, MACD, and moving averages to improve accuracy. Pair them with risk management strategies, such as stop-loss orders, for better results.
1. Bearish Engulfing
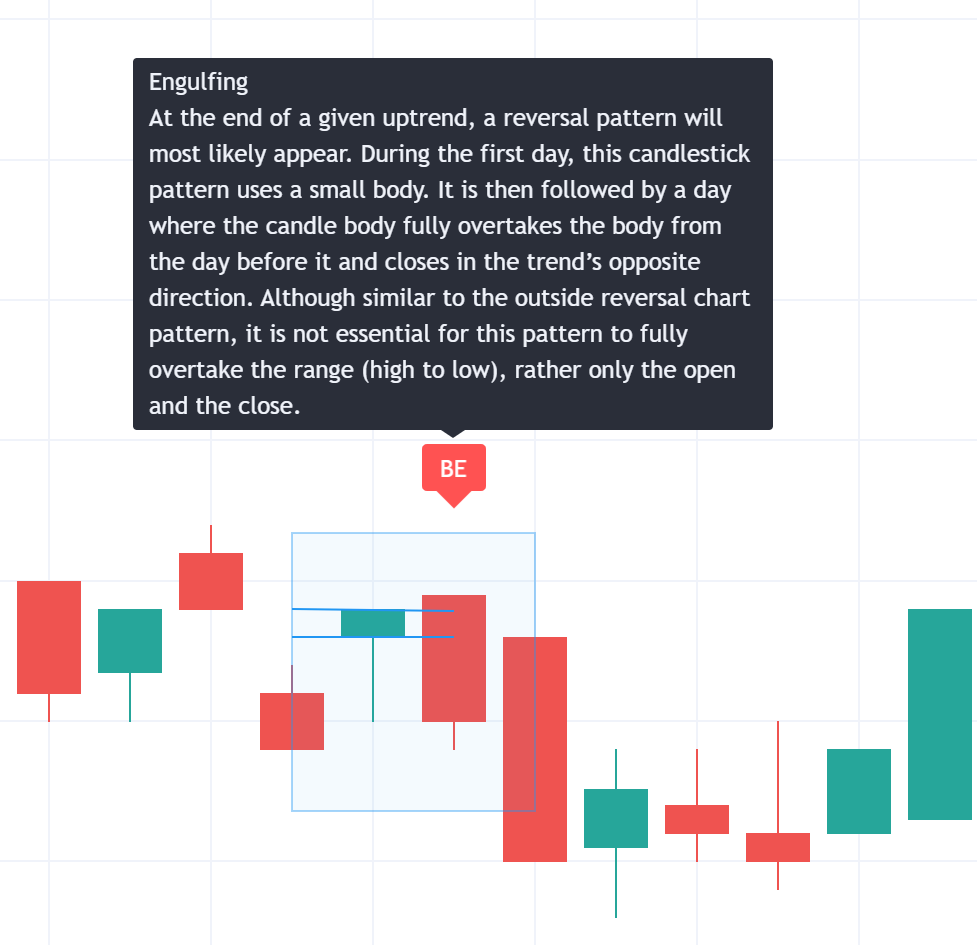
The Bearish Engulfing pattern forms when a large bearish candle fully engulfs the body of a smaller bullish candle. This signals a shift in control from buyers to sellers [1].
Pattern Structure
For this pattern to appear, the second candle must open above the previous candle's close and close below its open. This shows sellers have taken charge [1].
Confirmation Signals
Look for additional signs to confirm the pattern, such as:
- A gap down (price opening lower than the previous close)
- A drop below key moving averages like the 50-day or 200-day
- A follow-up bearish candle [1] [2]
These signals strengthen the case for a potential reversal.
Volume Analysis
High trading volume during the bearish candle adds weight to the pattern. It indicates strong selling pressure and broader market participation, making the signal more dependable [2].
Market Context
This pattern is most effective during an uptrend, particularly near resistance or overbought levels. LuxAlgo offers hundreds of free trading indicators along with exclusive features and an AI Backtesting platform, enabling traders to combine volume and trend analysis for a more comprehensive evaluation.
| Aspect | Key Characteristics |
|---|---|
| Pattern Structure | Bearish candle engulfs smaller bullish candle |
| Best Location | Uptrend, near resistance |
| Volume | Higher than average during bearish candle |
| Confirmation | Gap down, break below moving averages, or follow-up bearish candle |
Though the Bearish Engulfing pattern is a strong reversal signal, other formations, such as the Dark Cloud Cover, can also highlight changing market sentiment.
2. Dark Cloud Cover
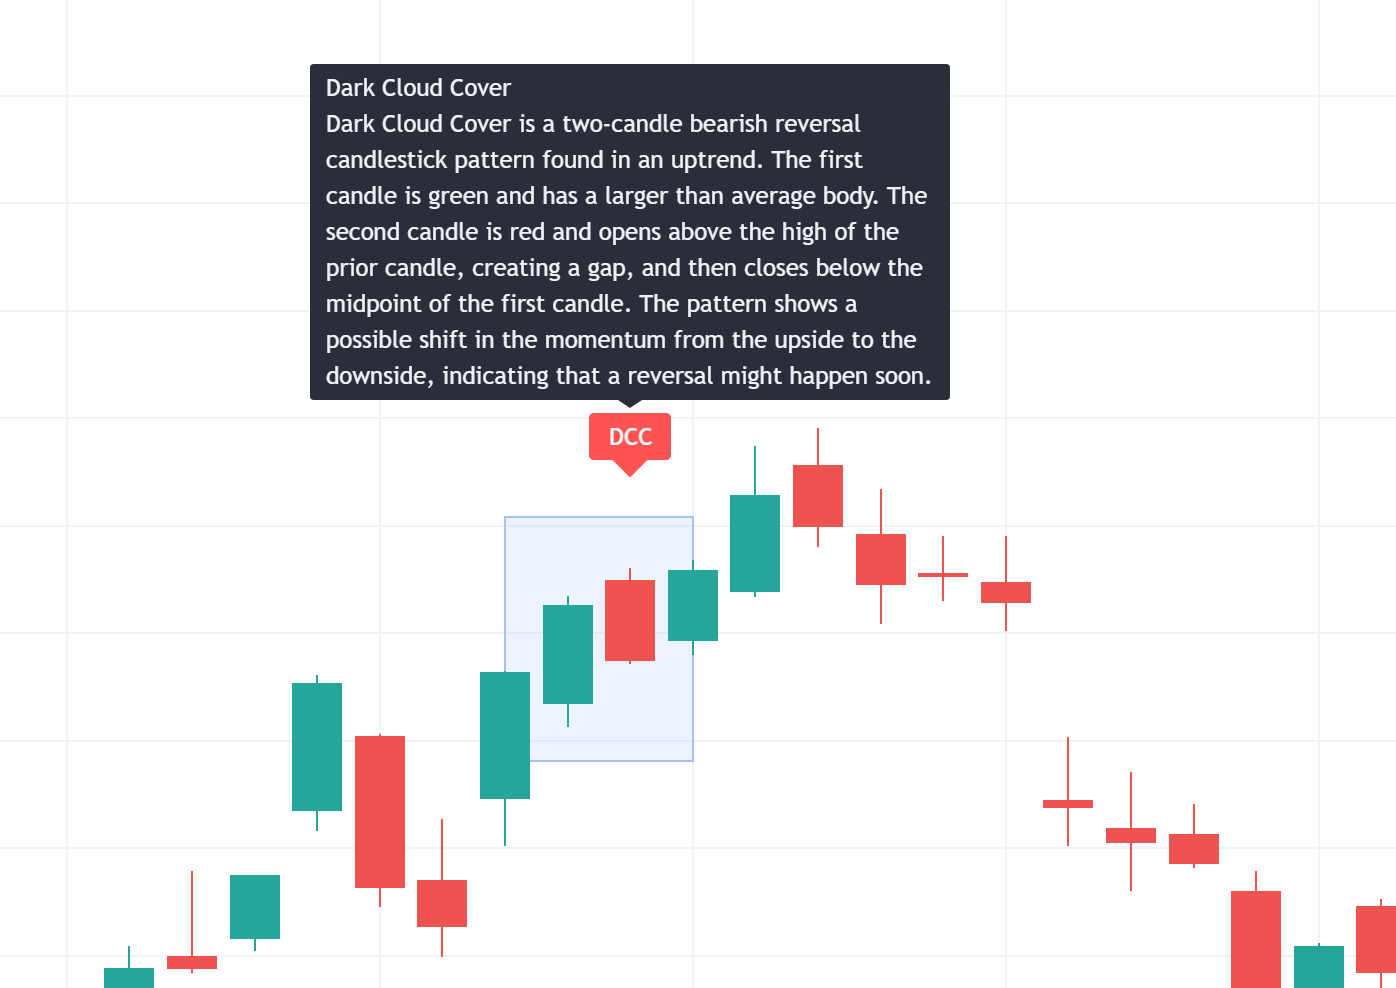
The Dark Cloud Cover is a bearish reversal pattern that appears during upward trends, hinting at a possible shift from buying to selling momentum.
Pattern Structure
This pattern features two candles: a long white (bullish) candle followed by a black (bearish) one. The second candle opens above the high of the first but closes below its midpoint, signaling that sellers are gaining control [1].
Confirmation Signals
Traders often look for the following to confirm this pattern:
| Signal Type | Key Indicators |
|---|---|
| Price & Behavior | A gap down, a subsequent bearish candle, and strong selling pressure |
| Technical | A break below important moving averages, like the 50-day or 200-day |
Volume Analysis
If the bearish candle in the Dark Cloud Cover forms with increased trading volume, it underscores stronger selling pressure compared to typical reversals [2].
Market Context
This pattern works best in a strong uptrend, especially near resistance levels, and when corroborated by other technical signals. LuxAlgo offers hundreds of free trading indicators along with exclusive features and an AI Backtesting platform that leverages AI-driven analysis combined with volume data to help traders spot these patterns.
"The Dark Cloud Cover pattern is considered one of the more reliable bearish reversal patterns due to its clear structure and the requirement for a significant price reversal" [1] [2].
While the Dark Cloud Cover highlights bearish momentum, patterns like the Evening Star can also provide valuable insights into market reversals.
3. Evening Star
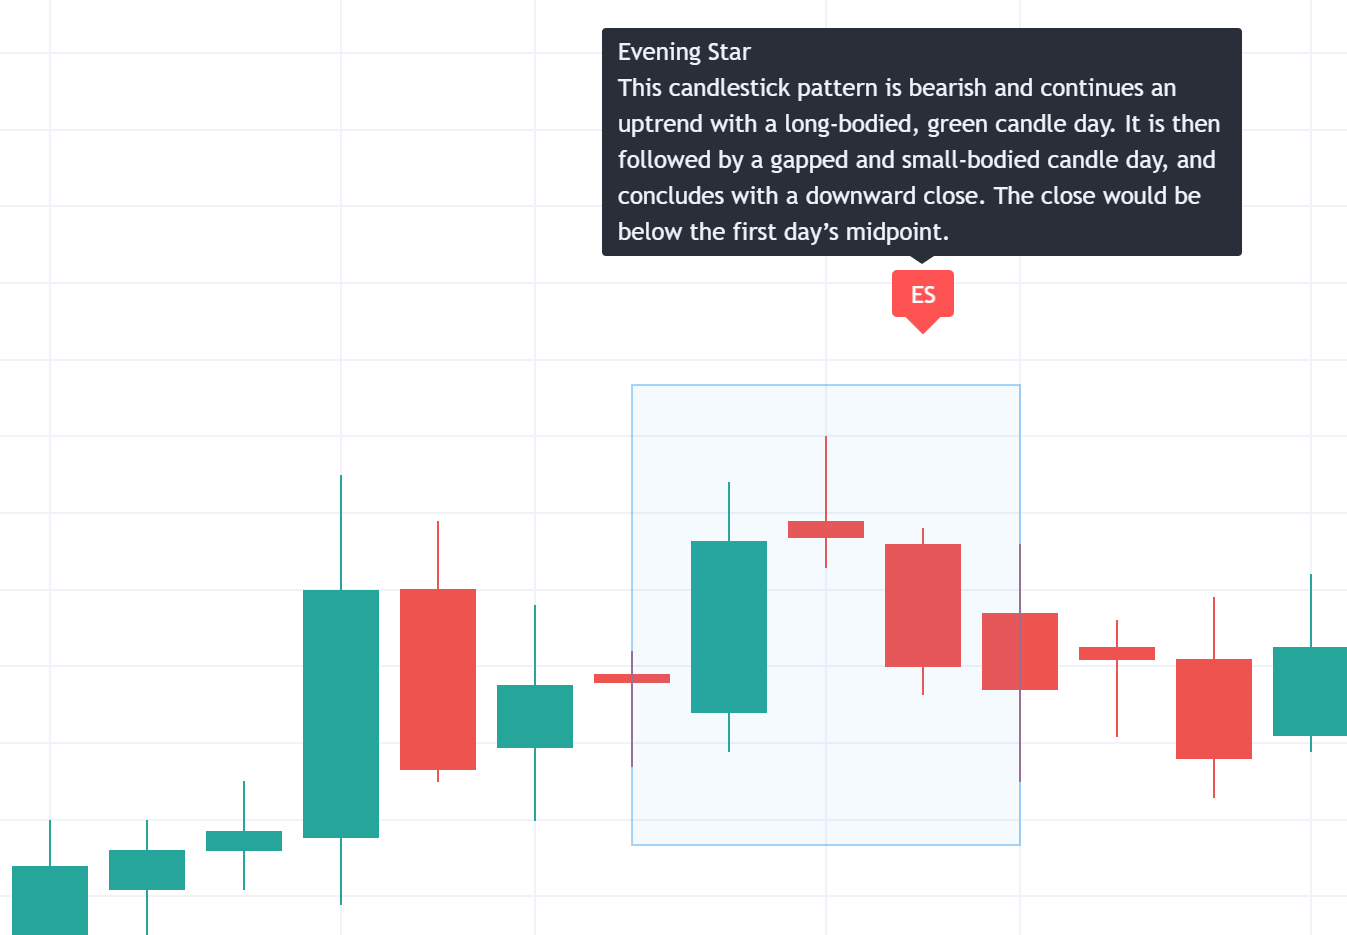
The Evening Star is a bearish reversal pattern that signals the end of an uptrend.
Pattern Structure
This pattern consists of three candles:
- A strong bullish candle
- A small-bodied candle that gaps up
- A bearish candle that closes below the midpoint of the first candle
Confirmation Signals
To increase confidence in the pattern, traders should watch for these key signals:
| Signal Type | Indicators | Importance |
|---|---|---|
| Price Action | Gap down after the third candle | Indicates strong bearish sentiment |
| Technical | Break below key moving averages | Confirms trend reversal |
Volume Analysis
If the third candle shows higher trading volume, it adds weight to the pattern, signaling strong selling pressure [2].
Market Context
The pattern's success depends on the broader market setup:
- Price trading above the 20-day exponential moving average (EMA)
- Higher highs and higher lows in previous price movements
- Formation near important resistance levels
Combining the Evening Star with volume analysis, moving averages, or advanced platforms such as LuxAlgo—which offers hundreds of free trading indicators along with exclusive features and an AI Backtesting platform leveraging AI-driven analysis—can help traders identify Evening Star setups with enhanced accuracy in real time.
While the Evening Star highlights a reversal, another bearish pattern to consider is the Shooting Star, which offers a simpler structure and perspective on downward momentum.
4. Shooting Star
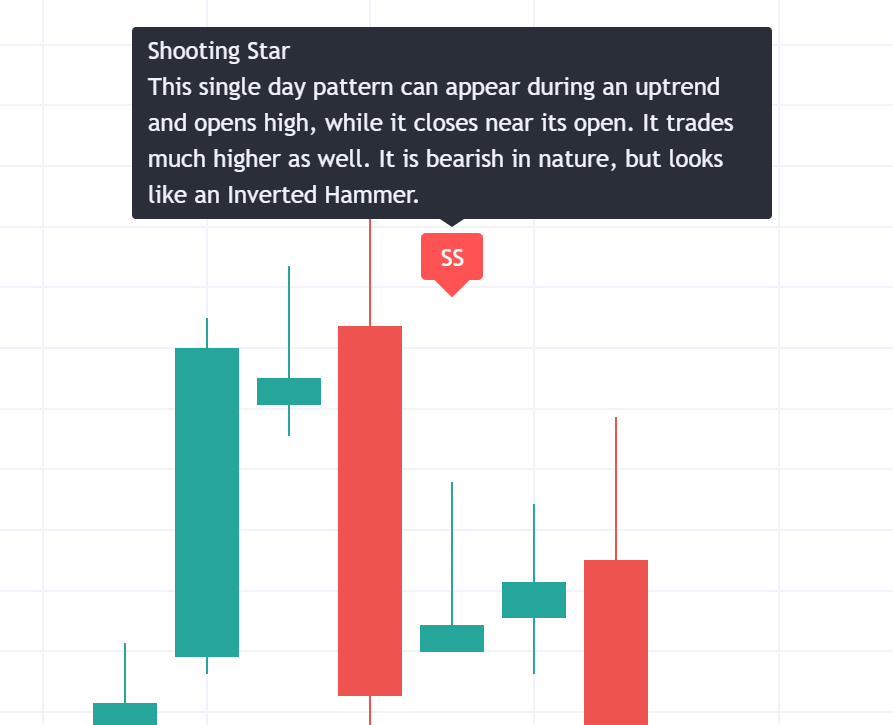
The Shooting Star is a well-known bearish reversal pattern, easily recognized by its single-candlestick structure and its ability to signal potential trend reversals.
Pattern Structure
This pattern features a small body positioned near the lower end of the price range, accompanied by a long upper shadow and little to no lower shadow. It reflects a scenario where buyers initially drive the price upward, but sellers regain control, pushing the price down by the close.
Trading Signals and Volume
The Shooting Star gains credibility when supported by high trading volume and specific confirmation signals, such as:
| Signal Type | Description |
|---|---|
| Price Action & Volume | A gap down, a long black candlestick, or increased trading volume within 1-3 days |
| Technical | A drop below short-term moving averages within 1-2 sessions |
High trading volume during the formation of the Shooting Star underscores strong selling pressure, boosting its dependability [2].
Market Context
This pattern works best during an uptrend, particularly near resistance levels or in overbought market conditions. Its accuracy improves when combined with moving averages or advanced platforms such as LuxAlgo, which offers hundreds of free trading indicators along with exclusive features and an AI Backtesting platform that utilizes AI-driven trend analysis.
The Shooting Star is a straightforward way to spot bearish momentum and potential reversals. While it provides a quick signal with a single candlestick, it can be paired with multi-candlestick patterns, like the Bearish Harami, to offer deeper insights into market reversals [1] [3].
5. Bearish Harami
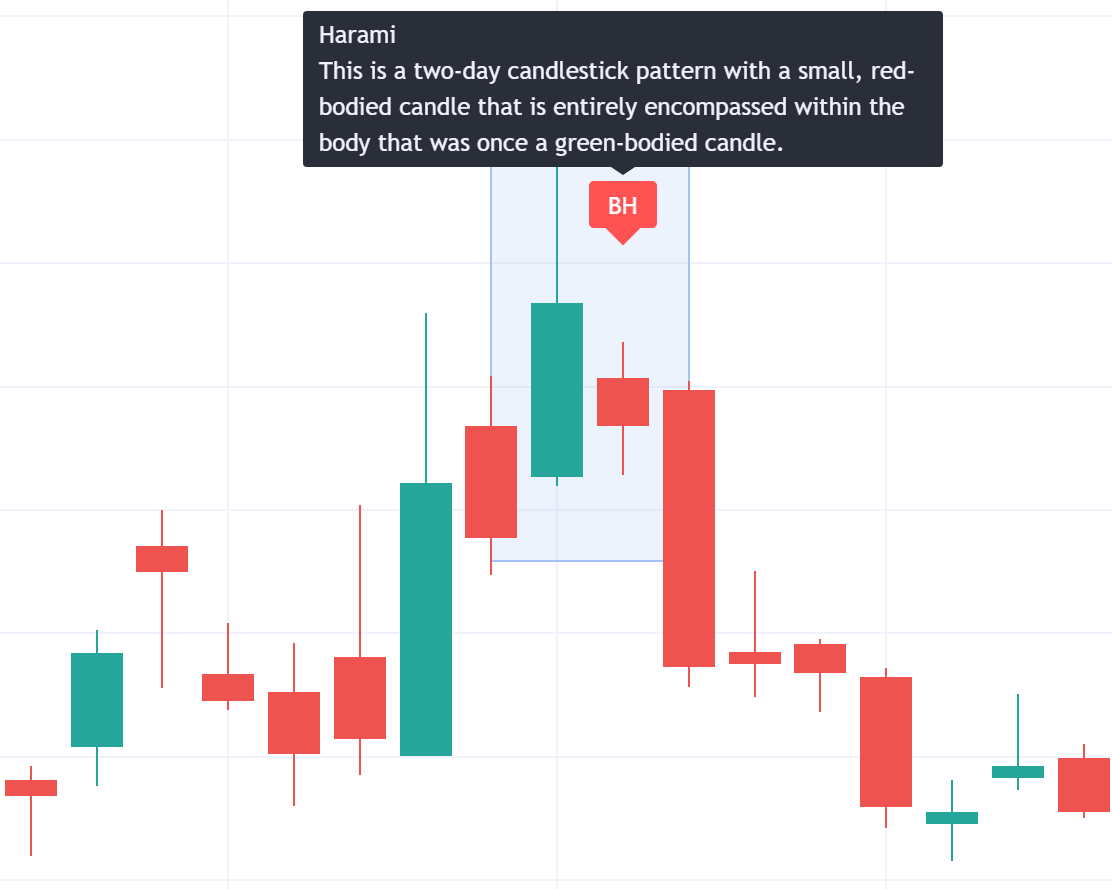
The Bearish Harami is a two-candlestick pattern that hints at a possible reversal during an upward trend.
Pattern Structure
This pattern is made up of two key candlesticks:
- A large bullish candlestick showing strong upward momentum.
- A smaller bearish candlestick that stays entirely within the body of the previous bullish candle.
This setup suggests that buyers are losing strength, and sellers are starting to gain control.
Confirmation Signals
To make the pattern more reliable, traders often look for confirmation signals:
| Signal Type | Indicators | What It Means |
|---|---|---|
| Technical | Gap down, black candlestick, or moving average crossover | Indicates growing bearish pressure |
| Oscillators | MACD, RSI, Stochastics | Highlights a shift in momentum |
Volume Analysis
A noticeable increase in trading volume during the second candlestick strengthens the pattern's reliability. High volume here signals a clear change in market sentiment.
Market Context
The Bearish Harami works best when it appears:
- In a strong uptrend.
- Near major resistance levels.
- When the market is overbought.
Indicators like RSI and MACD can help confirm waning momentum, adding weight to the Bearish Harami signal. Traders should combine it with other indicators and use stop-loss orders to manage potential risks.
When paired with other reversal patterns, the Bearish Harami can offer a well-rounded view of possible market downturns. Unlike the subtle signals of the Bearish Harami, the next pattern, Three Black Crows, provides a stronger confirmation of bearish momentum.
6. Three Black Crows
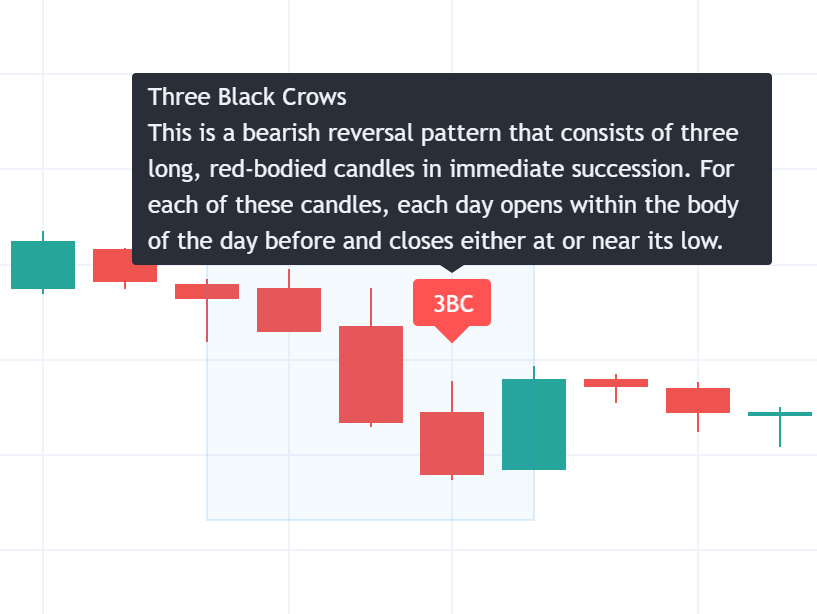
The Three Black Crows pattern is a well-known bearish reversal signal, often used to spot clear trend changes. Its multi-candlestick structure provides stronger evidence of a reversal compared to simpler patterns.
Pattern Structure and Key Features
This pattern is made up of three consecutive bearish candlesticks. Each one opens within the previous candle's body and closes lower, with very small or no lower shadows. This steady downward movement highlights consistent selling pressure over multiple sessions.
Signals to Watch For
| Signal Type | Indicator | What It Tells You |
|---|---|---|
| Price Action | Gap down after the third candle | Confirms strong bearish sentiment |
| Technical | Break below a key support level | Validates the likelihood of a reversal |
| Momentum | Declining RSI or MACD | Shows weakening buying strength |
The Role of Volume
Volume plays a critical role in confirming this pattern. If the volume increases across the three candles, it adds weight to the bearish signal, indicating growing selling pressure.
When It Works Best
The effectiveness of the Three Black Crows pattern improves when it aligns with the market’s broader behavior. Look for these conditions:
- The market is slowing down after a strong uptrend.
- Overall sentiment is starting to shift toward bearishness.
Modern trading platforms can simplify identifying this pattern by integrating technical indicators and volume analysis, helping traders act with more confidence [1] [2].
While the Three Black Crows give a strong multi-session signal, other patterns, like the Abandoned Baby, focus on different dynamics, such as gaps and isolated movements.
7. Abandoned Baby

The Abandoned Baby pattern is a bearish reversal signal that stands out due to its three-candlestick structure.
Pattern Structure and Confirmation
This pattern consists of three candles: a large bearish candle, a small bullish "baby" candle separated by gaps, and a final bearish candle that closes below the low of the first one. It signals a pause in an uptrend, followed by a strong shift to bearish control. Key confirmations include:
- A break below important support levels
- Indicators showing bearish momentum, such as RSI or MACD
- The final bearish candle closing below the low of the first candle
| Component | Characteristics |
|---|---|
| First Candle | Large bearish body |
| Middle Candle | Small bullish body with gaps |
| Final Candle | Large bearish body |
Volume Analysis
Volume spikes during the final bearish candle are crucial. They indicate strong selling pressure and validate the pattern's reliability.
Market Context
This pattern works best near resistance levels, after a prolonged uptrend, or in overbought conditions. It’s especially effective in areas where price has historically faced rejection. The defining feature here is the "abandoned" middle candle, which highlights a sudden and sharp change in market sentiment.
LuxAlgo offers hundreds of free trading indicators along with exclusive features and an AI Backtesting platform, enabling traders to identify the Abandoned Baby pattern through comprehensive technical analysis [1] [2].
While the Abandoned Baby is a strong bearish signal, its success depends on proper confirmation and its alignment with broader market trends.
How to Use Bearish Reversal Patterns Effectively
When trading bearish reversal patterns, pay attention to volume. High volume during bearish candles often indicates strong selling pressure. Technical indicators like RSI, MACD, and moving averages can help confirm these patterns by identifying overbought conditions, bearish crossovers, or potential trend changes [1].
Support and Resistance Analysis
Bearish patterns are more dependable when they appear near resistance levels. Look for volume increases, alignment across multiple timeframes, and clear trend signals to strengthen the reliability of these patterns [2].
Steps to Validate Patterns
- Identify the pattern structure: Ensure the pattern matches a recognized bearish reversal formation.
- Check volume levels: Look for above-average volume during the bearish move.
- Use technical indicators: Confirm with tools like RSI or MACD to validate the setup.
- Observe follow-through: Watch for bearish price action within 1-3 days after the pattern forms [1].
Managing Risk and Using Advanced Features
To limit potential losses, place stop-loss orders 1-2% above the pattern's high. LuxAlgo offers hundreds of free trading indicators along with exclusive features and an AI Backtesting platform that combine volume, momentum, and trend analysis—making it easier to spot high-probability trading setups.
Understanding Market Context
Bearish reversal patterns work best when they align with the broader market environment. Consider factors like overall market sentiment, recent news, timing, and historical price behavior to improve the reliability of your trades [2].
Key Success Factors
| Component | Key Considerations |
|---|---|
| Volume | Look for above-average volume on bearish moves |
| Technical Indicators | Ensure indicators align with the pattern |
| Price Action | Confirm with clear bearish follow-through |
| Risk Management | Use precise stop-loss placement |
Conclusion
Bearish reversal patterns, combined with robust technical analysis, can help improve trading accuracy. The seven patterns discussed in this article offer a starting point for spotting potential market reversals.
To trade effectively using bearish reversals, focus on these three principles:
- Pattern Identification: Spot and confirm patterns using price action and volume.
- Technical Validation: Use indicators like RSI, MACD, and moving averages to back up your signals.
- Risk Management: Set stop-loss orders and size positions based on the structure of the pattern.
For the best results, traders should:
- Verify there's an uptrend in place before expecting a reversal.
- Watch for bearish confirmation within 1-3 days.
- Use volume and momentum indicators to strengthen signals.
- Align trades with the overall market sentiment.
LuxAlgo offers hundreds of free trading indicators along with exclusive features and an AI Backtesting platform that simplify pattern recognition through comprehensive technical analysis and AI-driven insights. Remember, these patterns indicate probabilities, not guarantees. The key to success lies in combining them with a solid strategy and disciplined risk management.


