Explore essential TradingView indicators for identifying liquidity zones, crucial for effective trading strategies across various markets.
Liquidity zones are critical for traders as they mark areas of high buying or selling activity, often aligning with support and resistance levels. In this article, we explore five advanced liquidity indicators available in the LuxAlgo Library that help traders pinpoint these zones using refined price action and volume dynamics. These indicators cater to a range of trading styles—from those seeking to identify subtle order imbalances to traders looking to map significant liquidity clusters. All of these indicators are available on TradingView.
1. Buyside & Sellside Liquidity
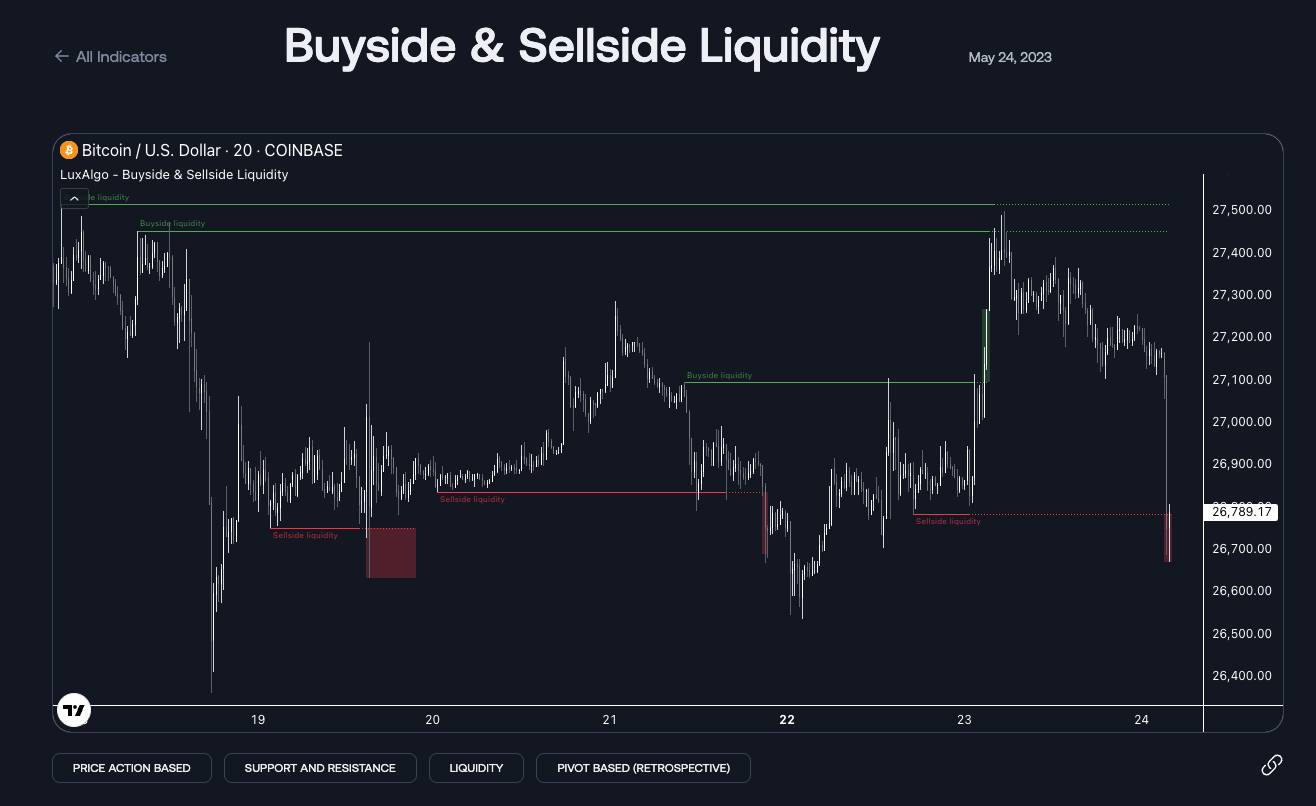
The Buyside & Sellside Liquidity indicator visually distinguishes areas dominated by buy orders from those dominated by sell orders. By clearly delineating these zones, it helps traders identify potential support and resistance regions driven by concentrated liquidity. Dynamic color-coding highlights shifts in market sentiment, making it easier to spot where institutional order clusters may lie. This indicator is especially useful when combined with other technical signals to confirm trade setups.
- Key Features:
- Distinct visualization of buyside (support) and sellside (resistance) zones.
- Highlights clusters of orders that may trigger reversals or breakouts.
- Integrates seamlessly with price action analysis for confirming trade setups.
2. Liquidity Sweeps
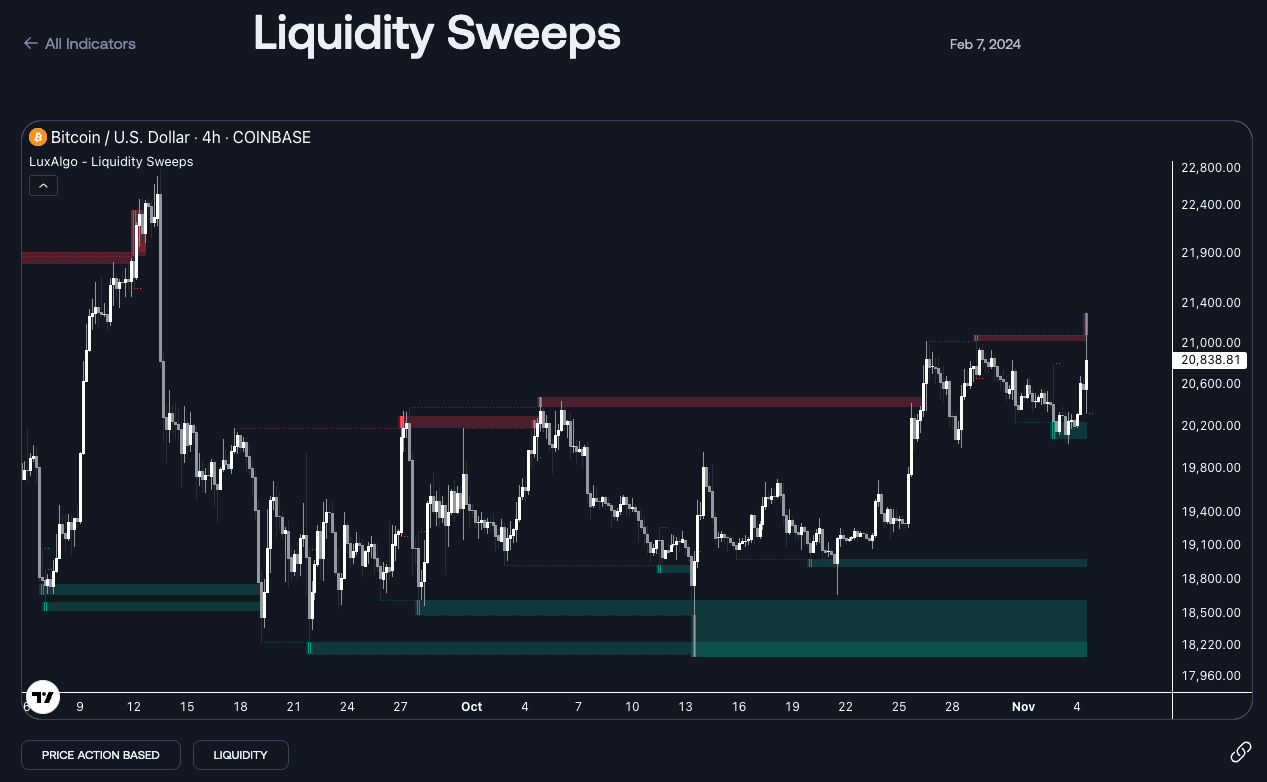
The Liquidity Sweeps indicator is designed to detect rapid movements through liquidity zones—often called liquidity sweeps. By marking these swift transitions, it helps traders spot areas where stop losses or order clusters have been quickly absorbed. This early warning system can signal potential reversals or breakout opportunities. Enhanced with real-time alerts, this indicator offers a dynamic glimpse into market activity, which is especially useful during volatile periods.
- Key Features:
- Identifies rapid liquidity absorption events.
- Highlights potential stop loss clusters and areas of order exhaustion.
- Provides real-time alerts for dynamic market shifts.
3. Pure Price Action Liquidity Sweeps
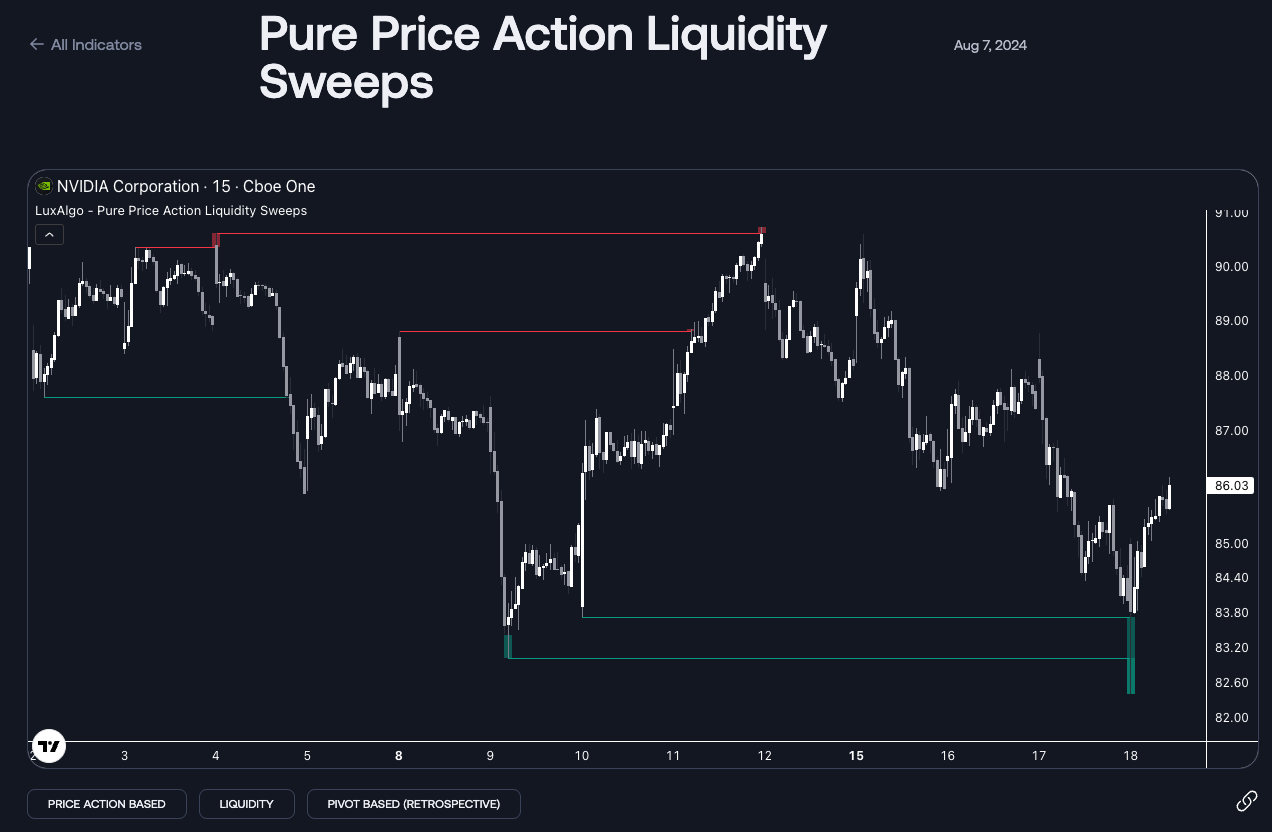
Focusing solely on price behavior, the Pure Price Action Liquidity Sweeps indicator isolates liquidity events derived exclusively from price movements. By filtering out volume noise, it offers traders a clean and uncluttered view of liquidity sweeps. This makes it particularly useful in markets where volume data may be erratic or misleading, enabling traders to base decisions solely on price action.
- Key Features:
- Emphasizes liquidity events driven purely by price dynamics.
- Delivers an uncluttered visualization for clear analysis.
- Complements other technical methods for confirming liquidity zones.
4. Liquidity Pools
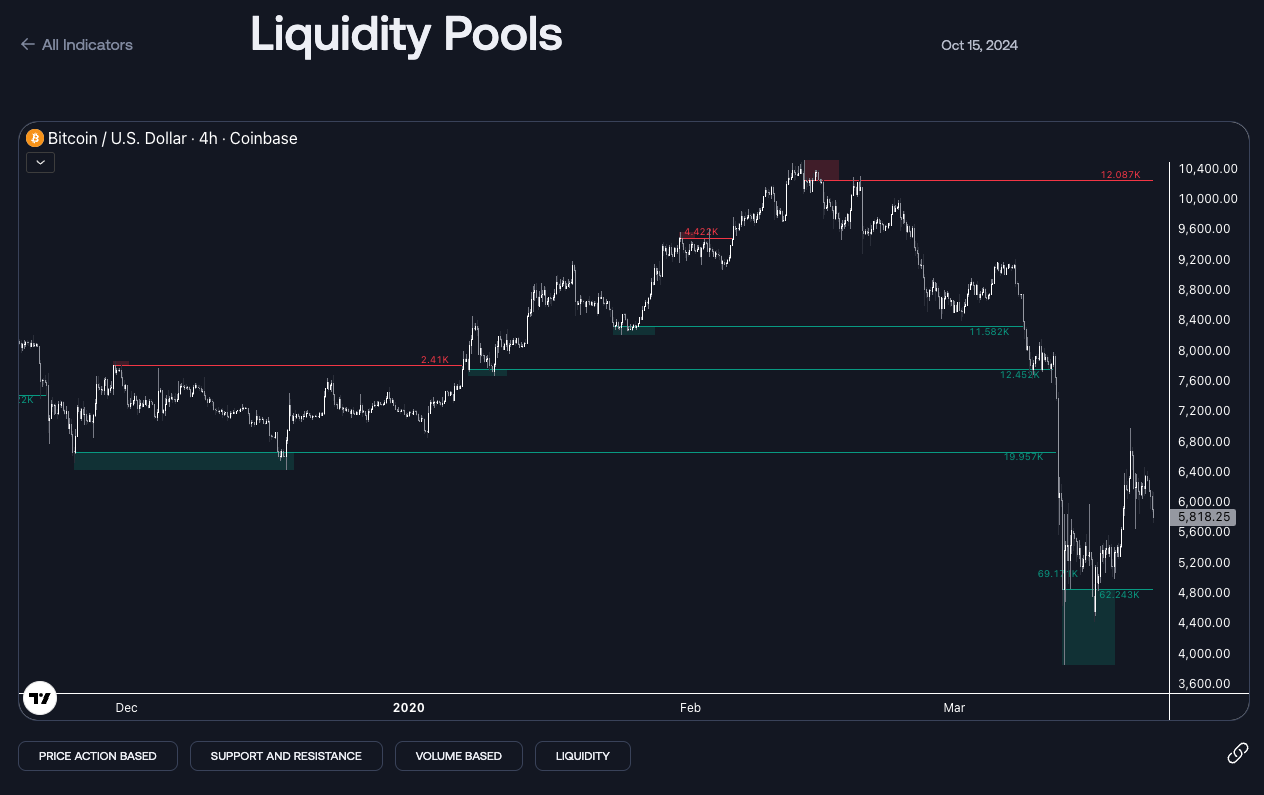
The Liquidity Pools indicator maps areas on the chart where liquidity accumulates, revealing clusters of orders that can act as significant support or resistance levels. By pinpointing these pools, traders can better anticipate market reversals or breakouts. The indicator’s clustering algorithm helps identify where large institutional positions may be built or defended, providing valuable insights into market structure.
- Key Features:
- Visually identifies regions of high order concentration.
- Highlights potential reversal or breakout zones.
- Can be used alongside other technical analysis methods to validate trading setups.
5. Liquidity Levels/Voids (VP)
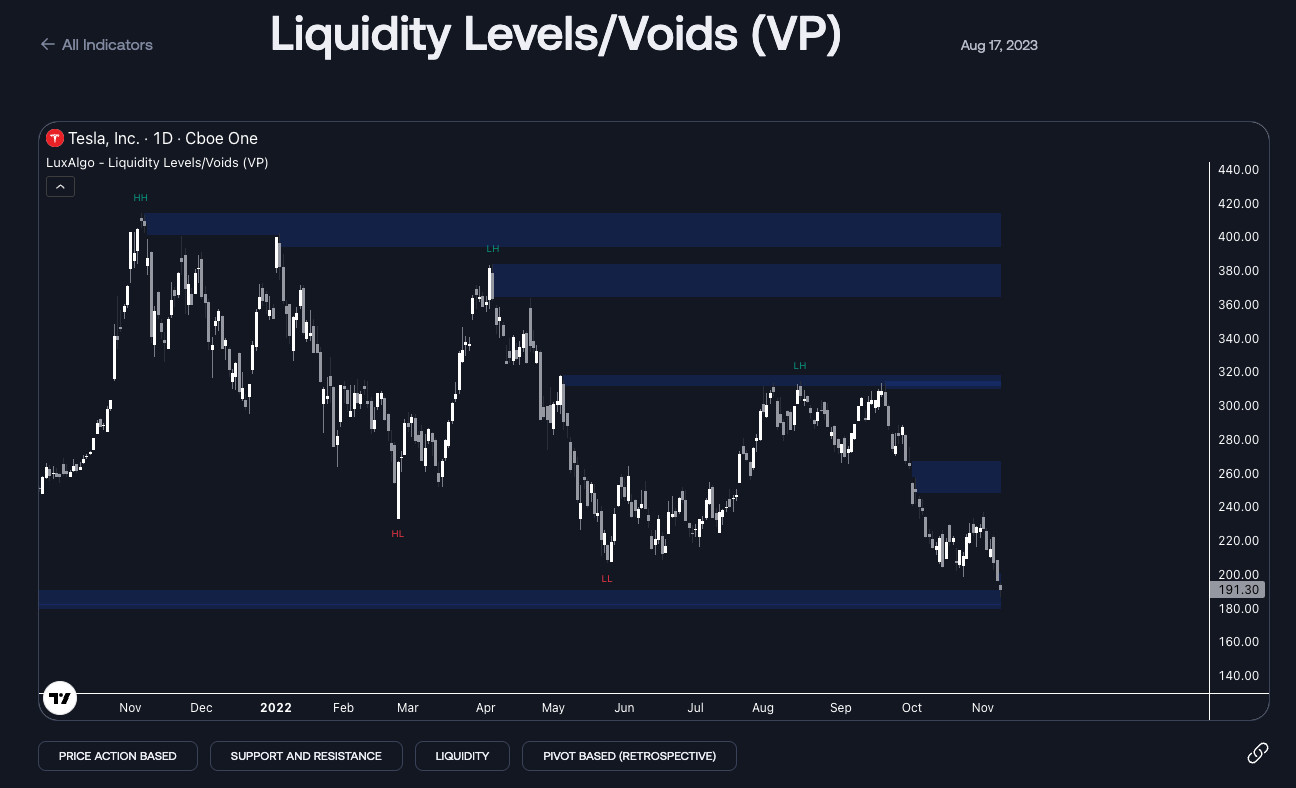
The Liquidity Levels/Voids (VP) indicator provides a detailed mapping of liquidity distributions by highlighting both areas of concentrated liquidity and voids where liquidity is scarce. These insights enable traders to identify key market levels and potential price targets, as gaps in liquidity can signal areas of rapid price movement or consolidation. This indicator is particularly beneficial for spotting momentum shifts and potential breakouts.
- Key Features:
- Maps zones of high liquidity alongside areas lacking liquidity.
- Helps pinpoint key support and resistance levels.
- Enhances analysis by correlating liquidity gaps with price behavior.
Final Thoughts
Choosing the right liquidity indicator depends on your trading approach and the specific market conditions. The five indicators discussed above from the LuxAlgo Library offer a range of techniques—from distinguishing order imbalances with Buyside & Sellside Liquidity to detecting rapid liquidity absorption with Liquidity Sweeps. When used in combination with traditional technical analysis, these indicators provide a comprehensive view of market liquidity, helping traders refine their entries and exits.
As market conditions evolve, it is essential to regularly review and adjust your analysis methods. LuxAlgo’s free library of indicators ensures that traders have access to advanced, real-time data on TradingView, complementing strategies for both beginners and experienced traders.
FAQs
Is there a liquidity indicator on TradingView?
Yes, TradingView offers a wide range of advanced liquidity indicators. All the indicators listed above—Buyside & Sellside Liquidity, Liquidity Sweeps, Pure Price Action Liquidity Sweeps, Liquidity Pools, and Liquidity Levels/Voids (VP)—are available on TradingView. These tools are designed to work seamlessly within TradingView’s ecosystem, providing traders with real-time insights into market liquidity and order flow.


