Explore essential tools for momentum screening on TradingView, including indicators and AI-driven solutions for effective market analysis.
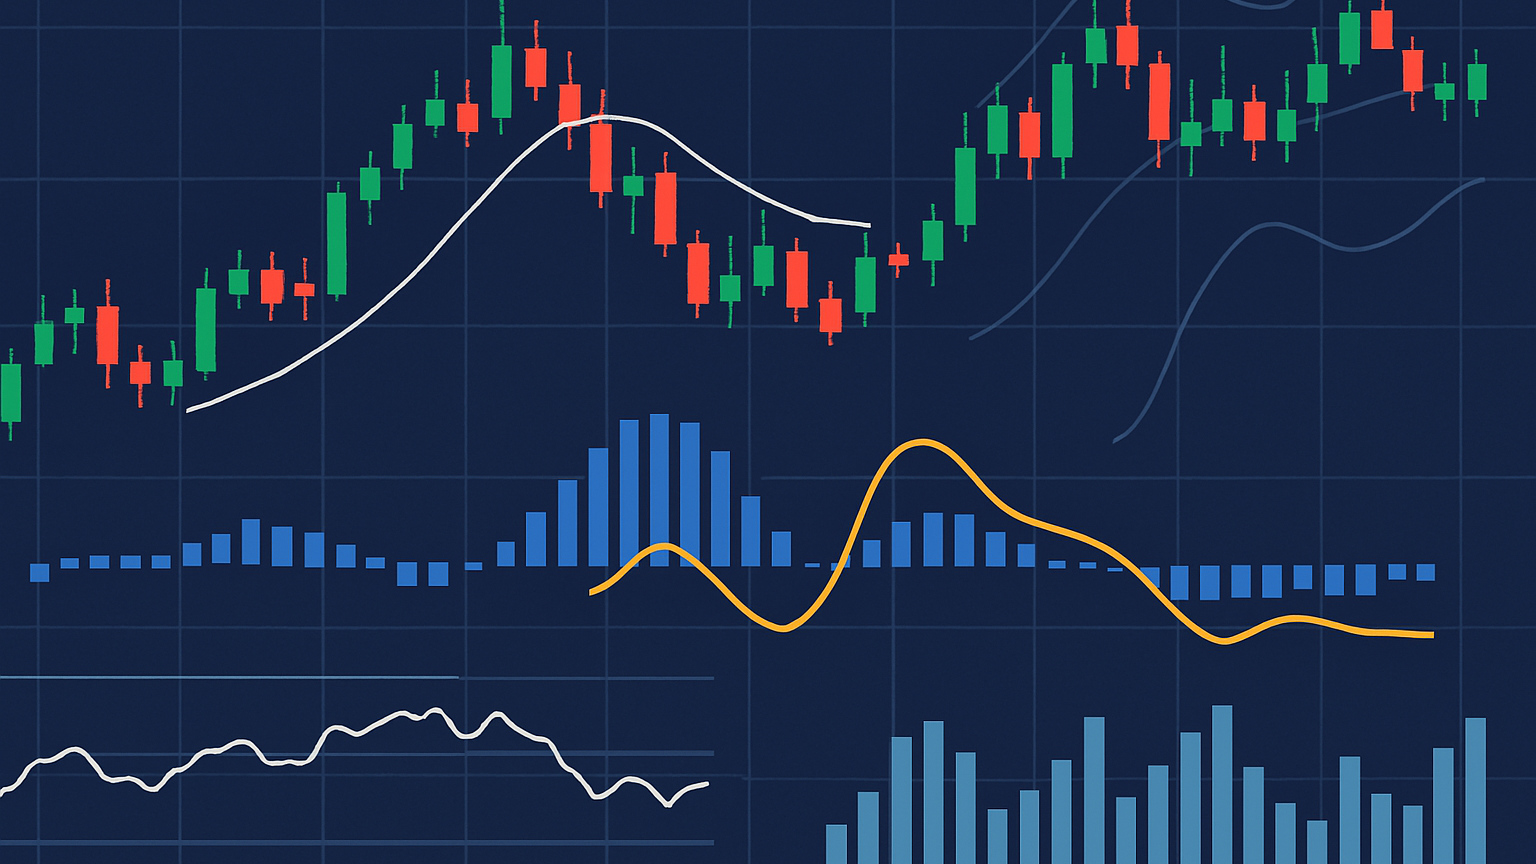
Momentum screening is key for identifying market trends and strong price movements. TradingView offers a variety of tools—from basic indicators to advanced AI‐driven solutions—to help traders analyze momentum effectively. Here's a quick rundown of the top tools:
- Momentum Indicator (MOM): Tracks price changes to spot trend reversals.
- Relative Strength Index (RSI): Identifies overbought or oversold conditions.
- Moving Averages (SMA, EMA, WMA): Highlights trend direction and strength.
- Oscillator Matrix®: A comprehensive indicator combining 6+ unique components for powerful momentum analysis and trend detection.
- MACD (Moving Average Convergence Divergence): Measures trend strength and momentum shifts.
Quick Comparison:
| Tool | Best Use Case | Limitations | Signal Speed & Accuracy |
|---|---|---|---|
| Momentum Indicator | Short-term trading | Misleading in volatile markets | Medium |
| RSI | Spotting trend reversals | Sensitive to settings | High |
| Moving Averages | Following long-term trends | Reacts slowly | Medium |
| Oscillator Matrix® | Comprehensive momentum and trend analysis | Requires understanding its multiple components | Very High |
| MACD | Confirming trends | Struggles in sideways markets | Medium |
Each tool has unique strengths and weaknesses. Combining them can improve accuracy and help refine your trading strategy.
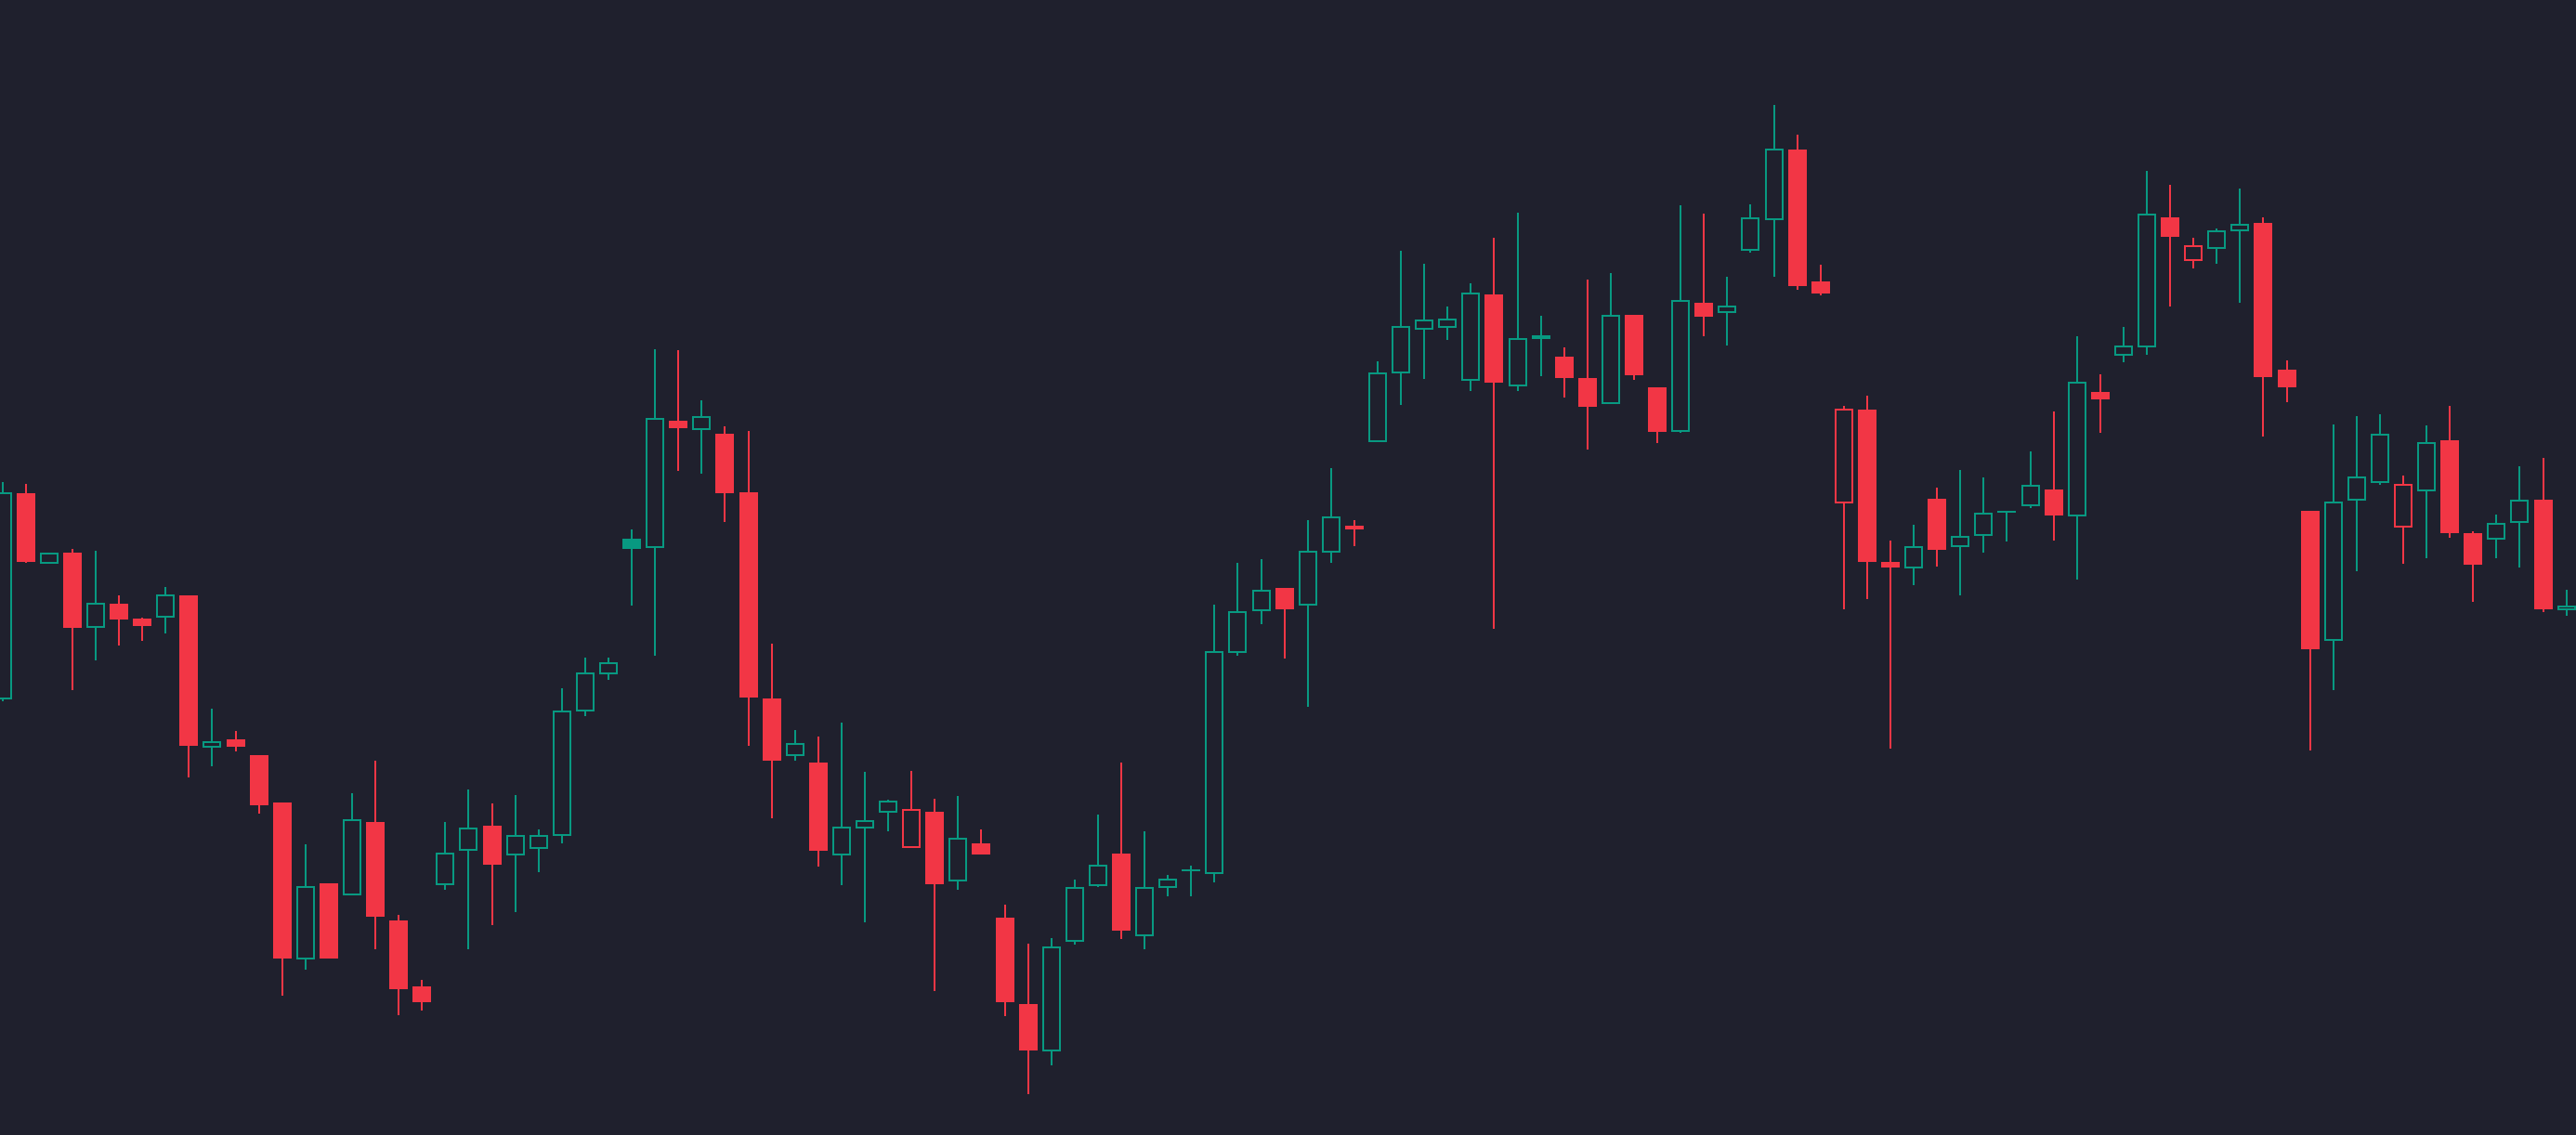
1. Momentum Indicator (MOM)
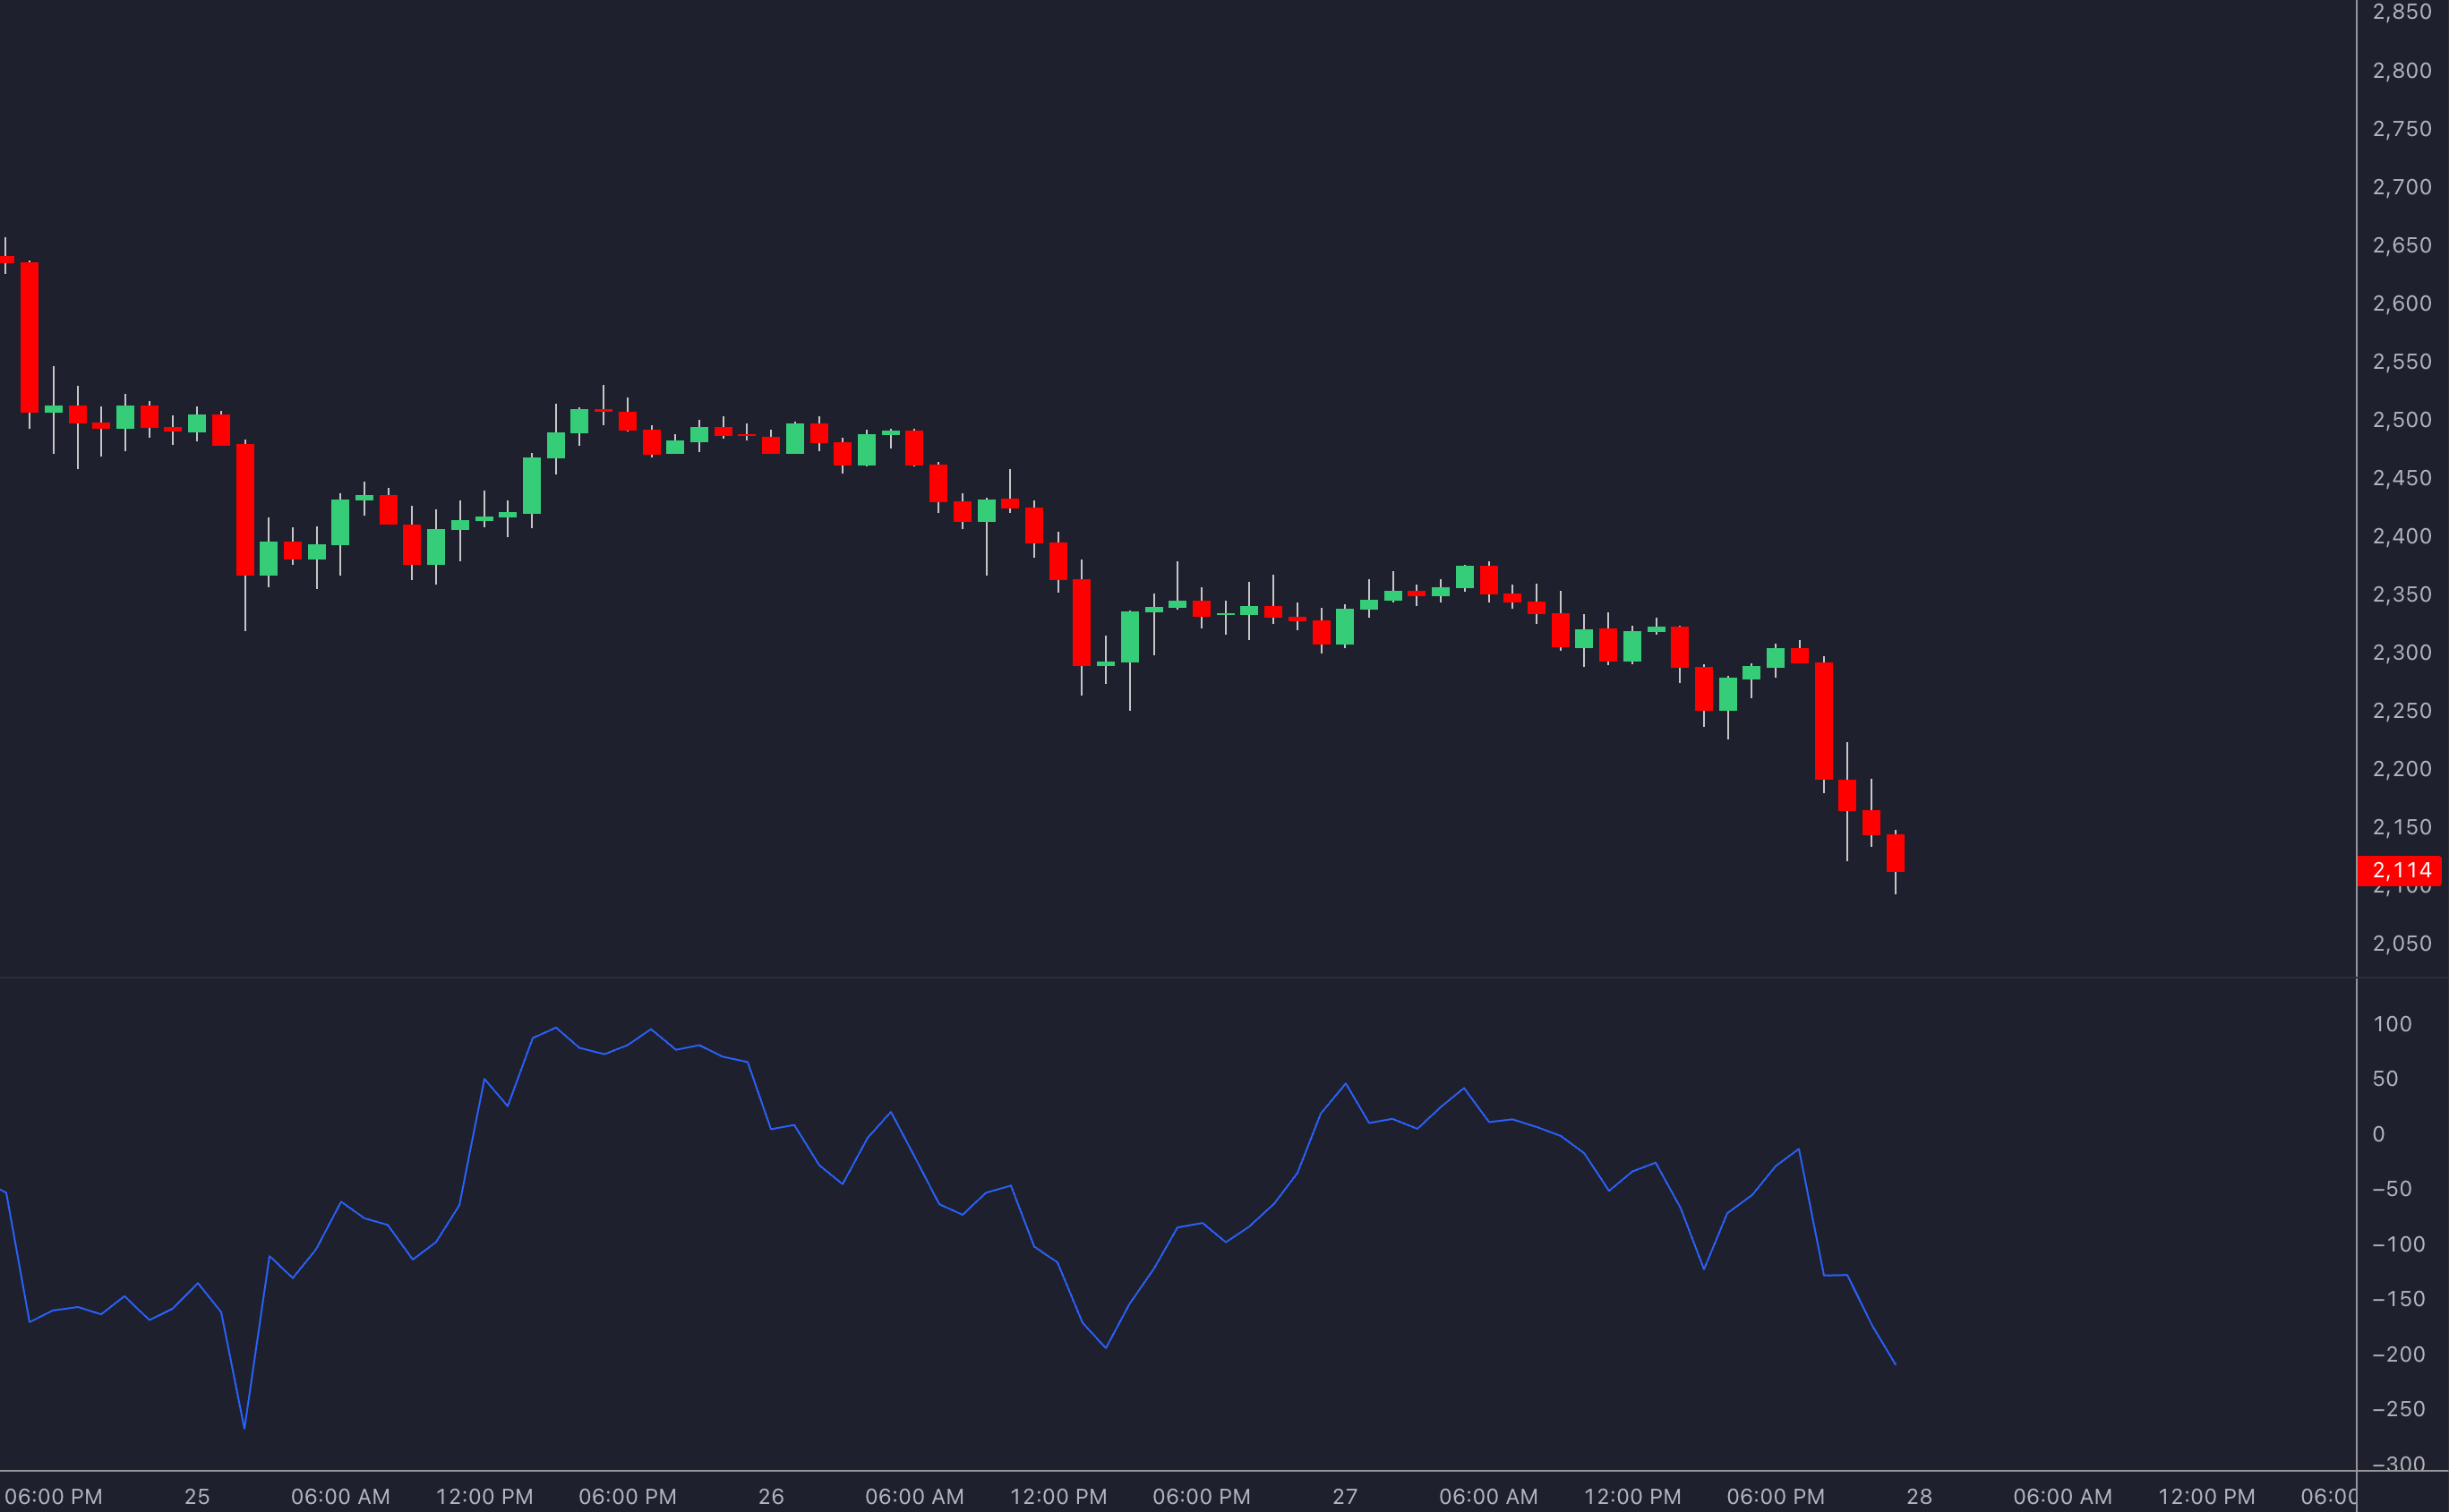
The Momentum Indicator (MOM) is designed to spot trend reversals and assess market strength on TradingView. It works by highlighting changes in market direction, helping traders identify trends. When the momentum line moves above zero, it suggests bullish momentum, while a drop below zero points to bearish momentum.
Key Features and How It Works
MOM calculates the price change over a specific period, providing insights into market strength and trend direction. With flexible lookback periods, real-time updates, and visual alerts on TradingView, MOM is a handy indicator for spotting momentum shifts.
How Traders Use It
Traders often use MOM to pinpoint potential entry and exit points as part of a broader strategy. Its effectiveness increases when combined with volume analysis, multi-timeframe checks, and custom alerts for specific momentum levels. Nonetheless, combining MOM with other indicators and robust risk management is recommended.
Customization Options
TradingView allows traders to adjust MOM settings—such as period length, signal parameters, and alert conditions—to align with their trading style.
Streamlined Screening
Using TradingView's custom screeners, traders can filter assets based on momentum criteria, making it easier to identify trading opportunities.
2. Relative Strength Index (RSI)
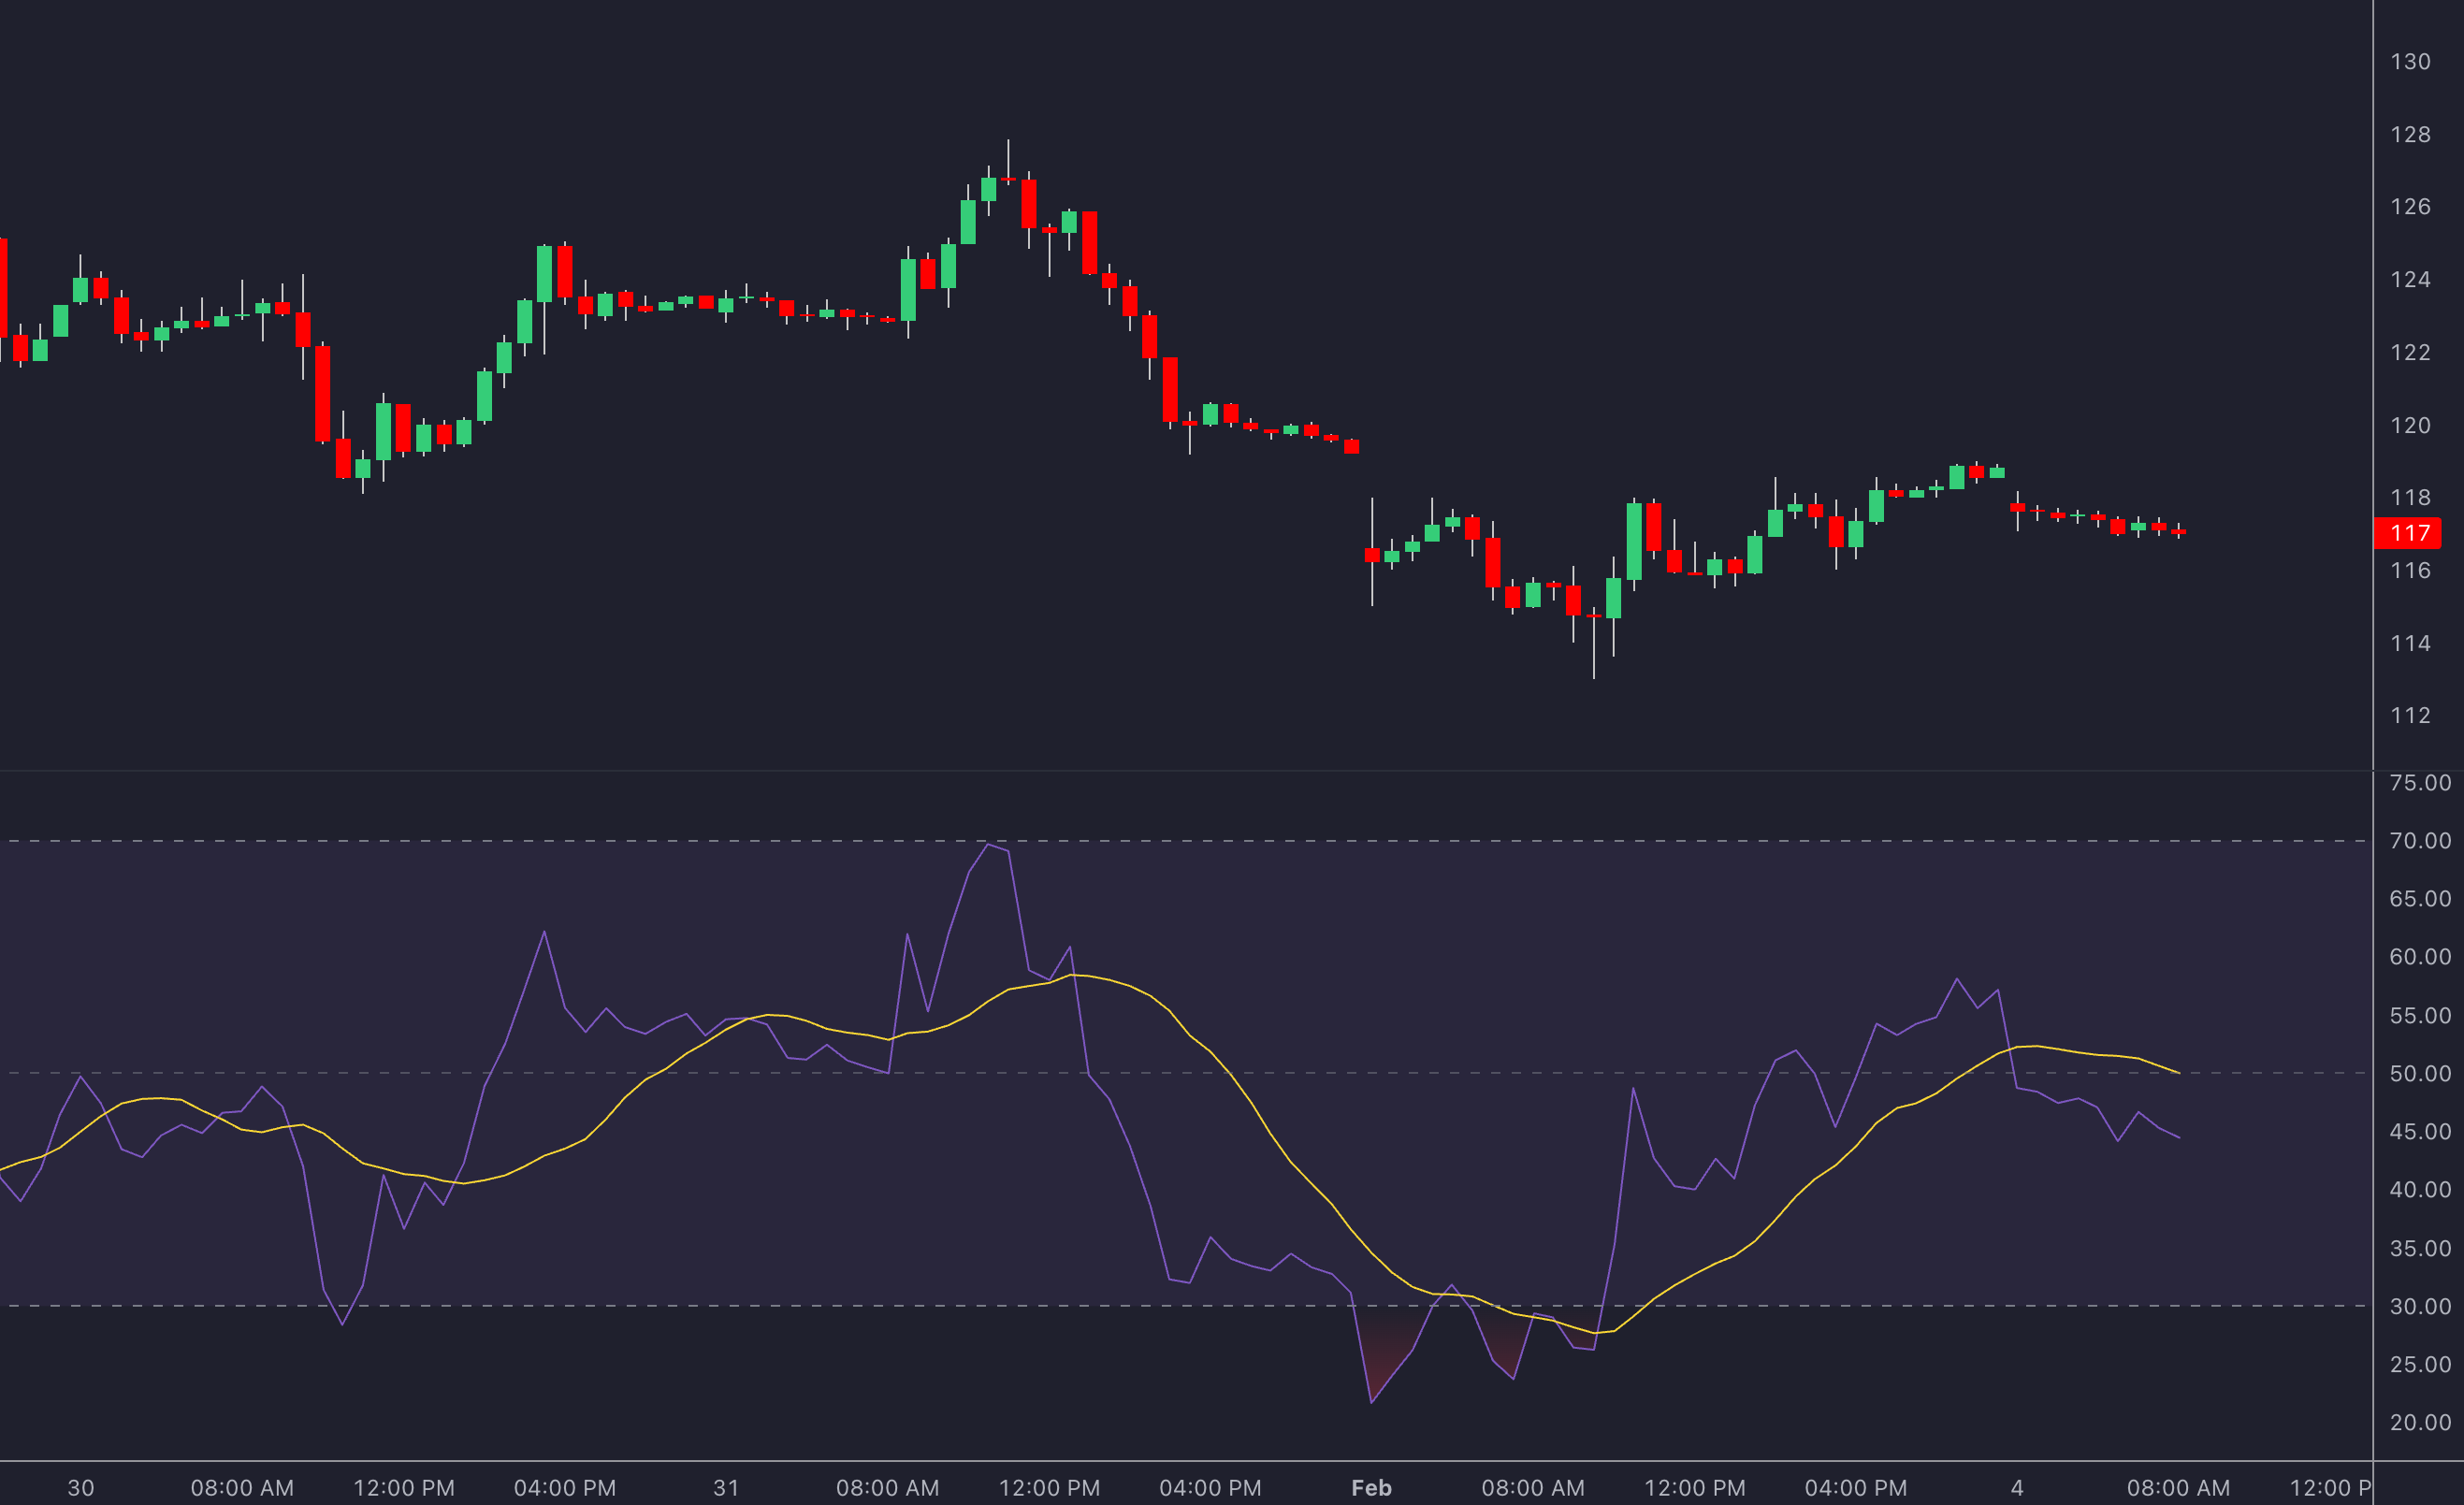
The RSI is a popular momentum oscillator used to analyze stocks, forex, and crypto markets. It compares recent price gains to losses, generating a value between 0 and 100. An RSI above 70 may indicate an overbought condition, while below 30 can signal an oversold market.
TradingView enhances RSI with real-time updates, customizable thresholds, visual alerts, and seamless integration with other indicators. Traders rely on RSI signals like divergences, trendline breaks, and centerline crosses to refine their analysis.
For sharper insights, combine RSI signals across multiple timeframes and with additional confirmation tools. RSI works especially well when paired with moving averages, volume-based tools, or price action patterns for a clearer view of momentum.
3. Moving Averages
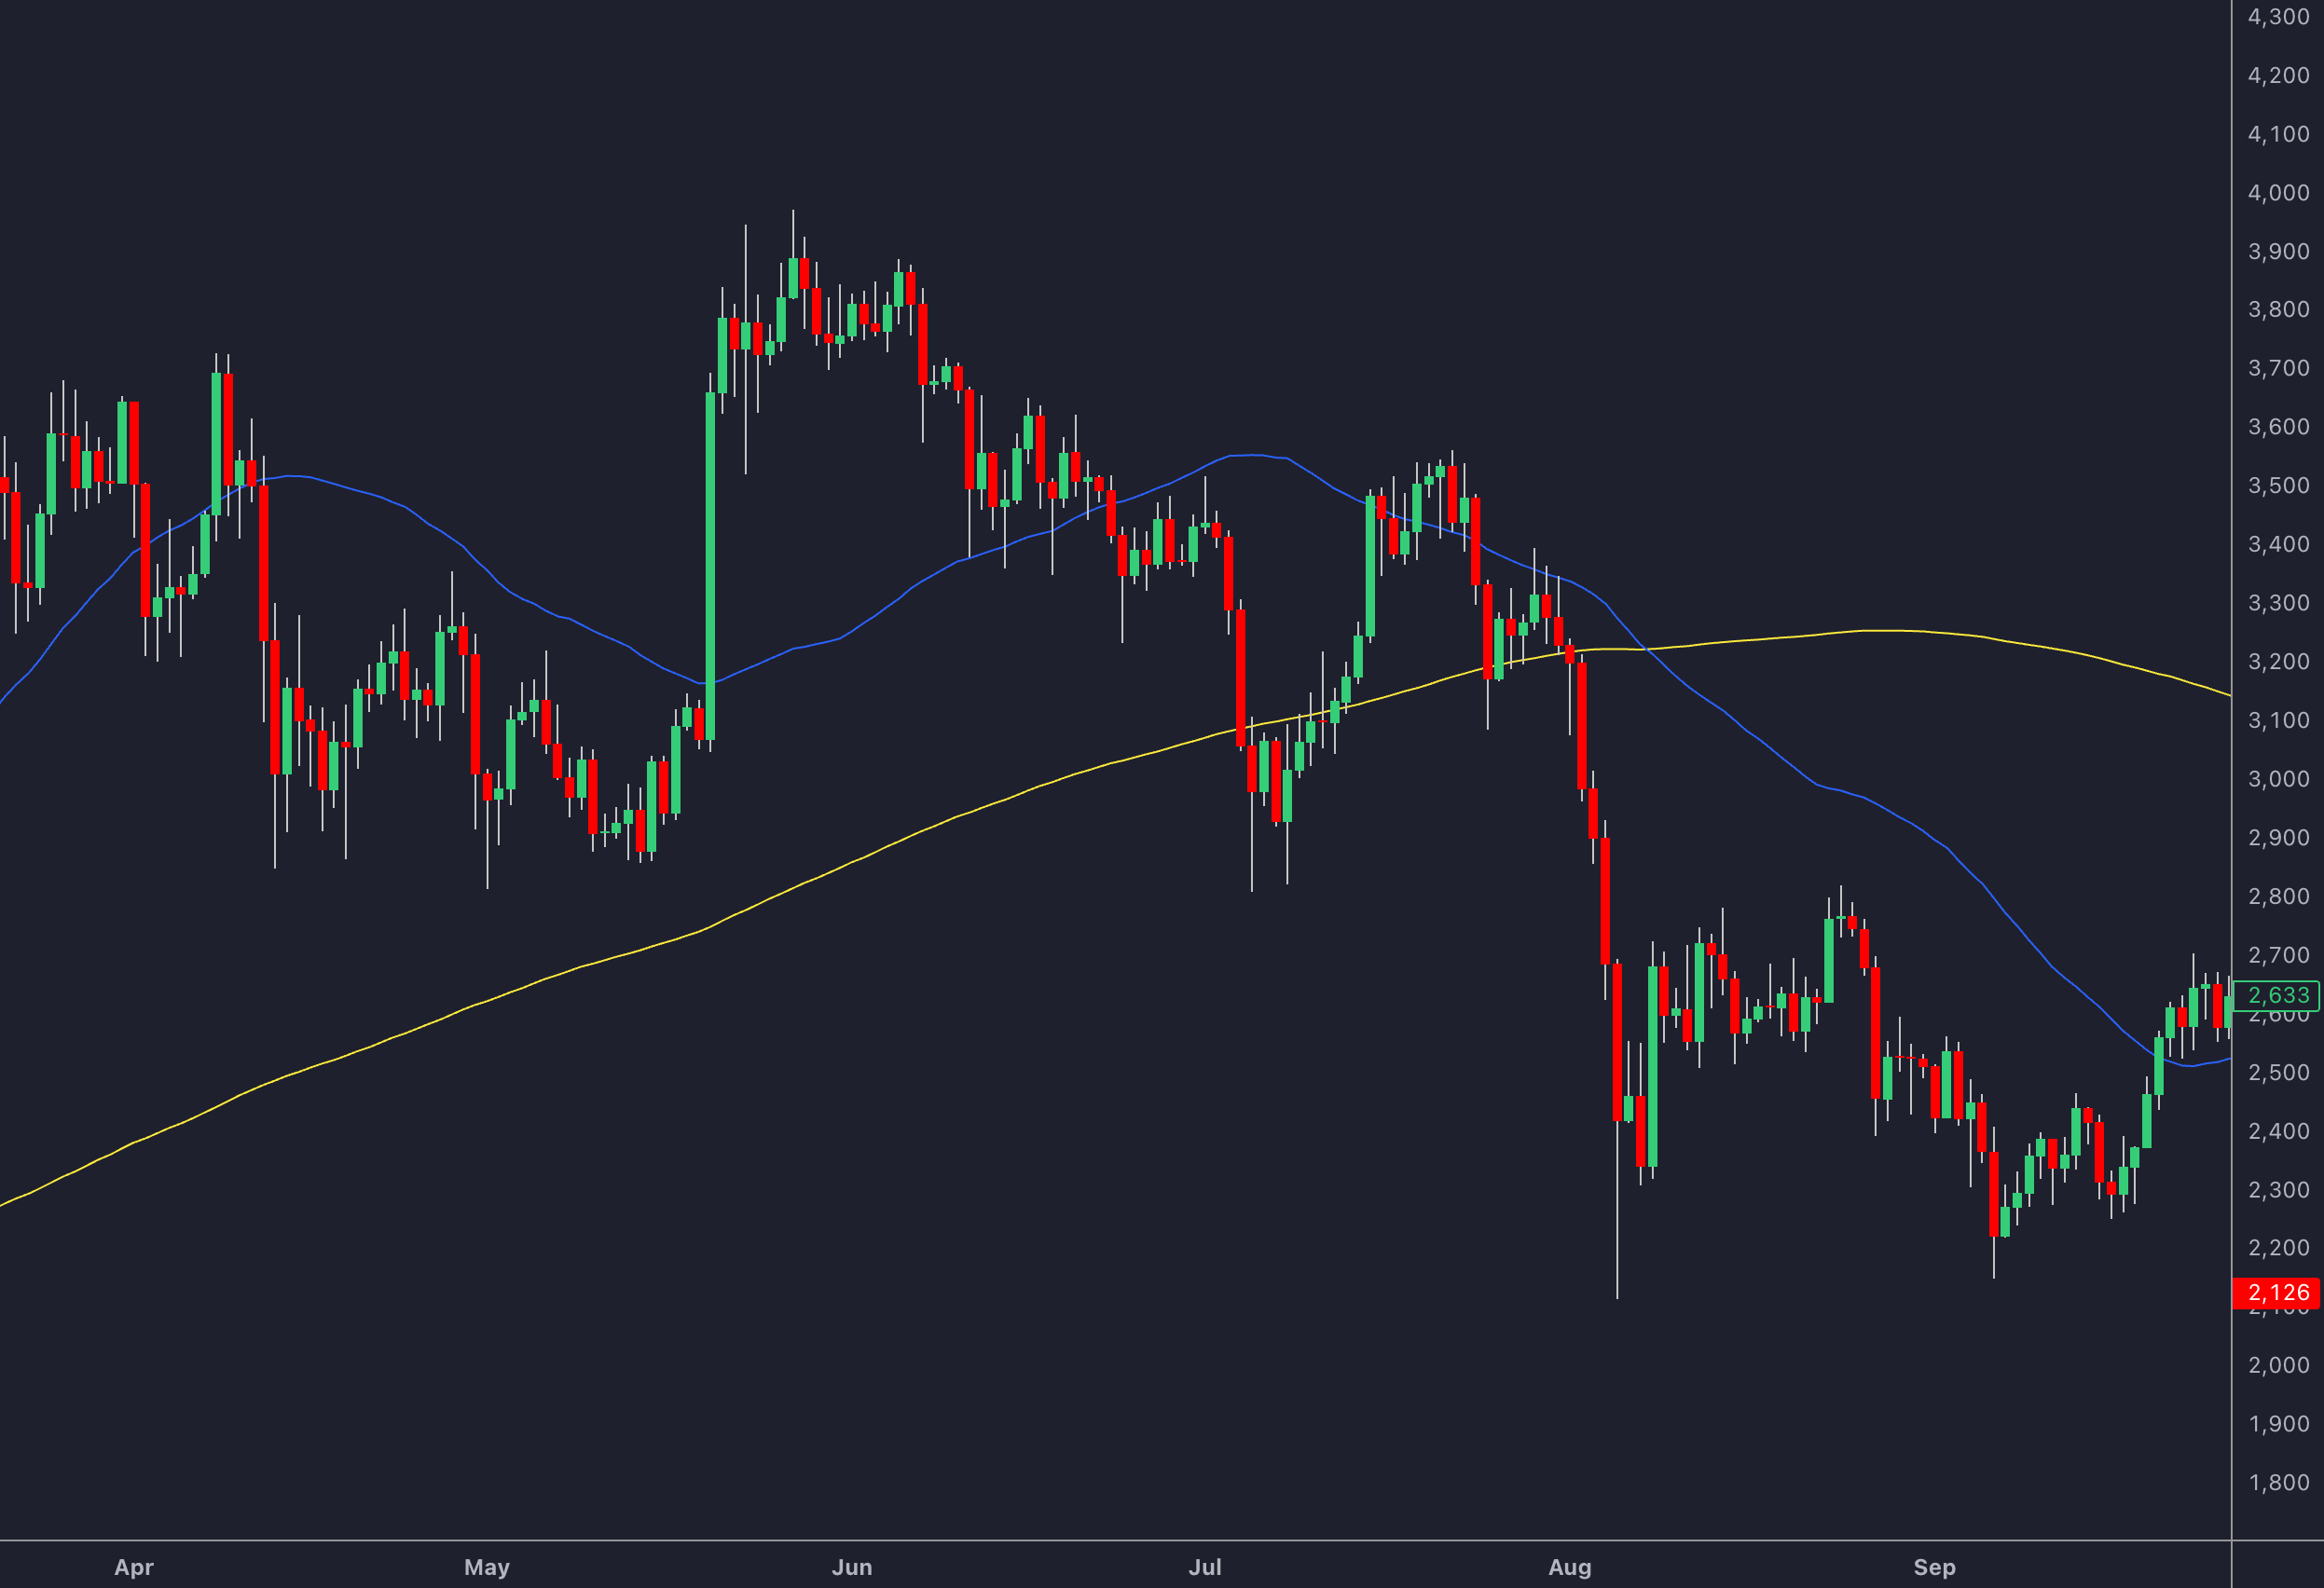
Moving averages are essential for momentum screening, helping traders identify changes in market trends. TradingView offers various types, including SMA (Simple Moving Average), EMA (Exponential Moving Average), and WMA (Weighted Moving Average), each smoothing out price trends differently.
A common strategy involves using multiple moving averages together. For instance, the golden cross—where the 50-day moving average rises above the 200-day moving average—signals bullish momentum, while the death cross indicates bearish momentum when the 50-day MA falls below the 200-day MA.
TradingView’s features like alerts, screeners, and overlays simplify monitoring these crossovers. Short-term averages (e.g., 10-day or 20-day) capture quick momentum shifts, while long-term averages (e.g., 50-day or 200-day) help identify sustained trends.
Pair moving averages with volume analysis or other indicators to refine your momentum screening strategy. Keep in mind that moving averages are lagging indicators, so a broader analysis approach is essential.
4. Oscillator Matrix® for Momentum Analysis
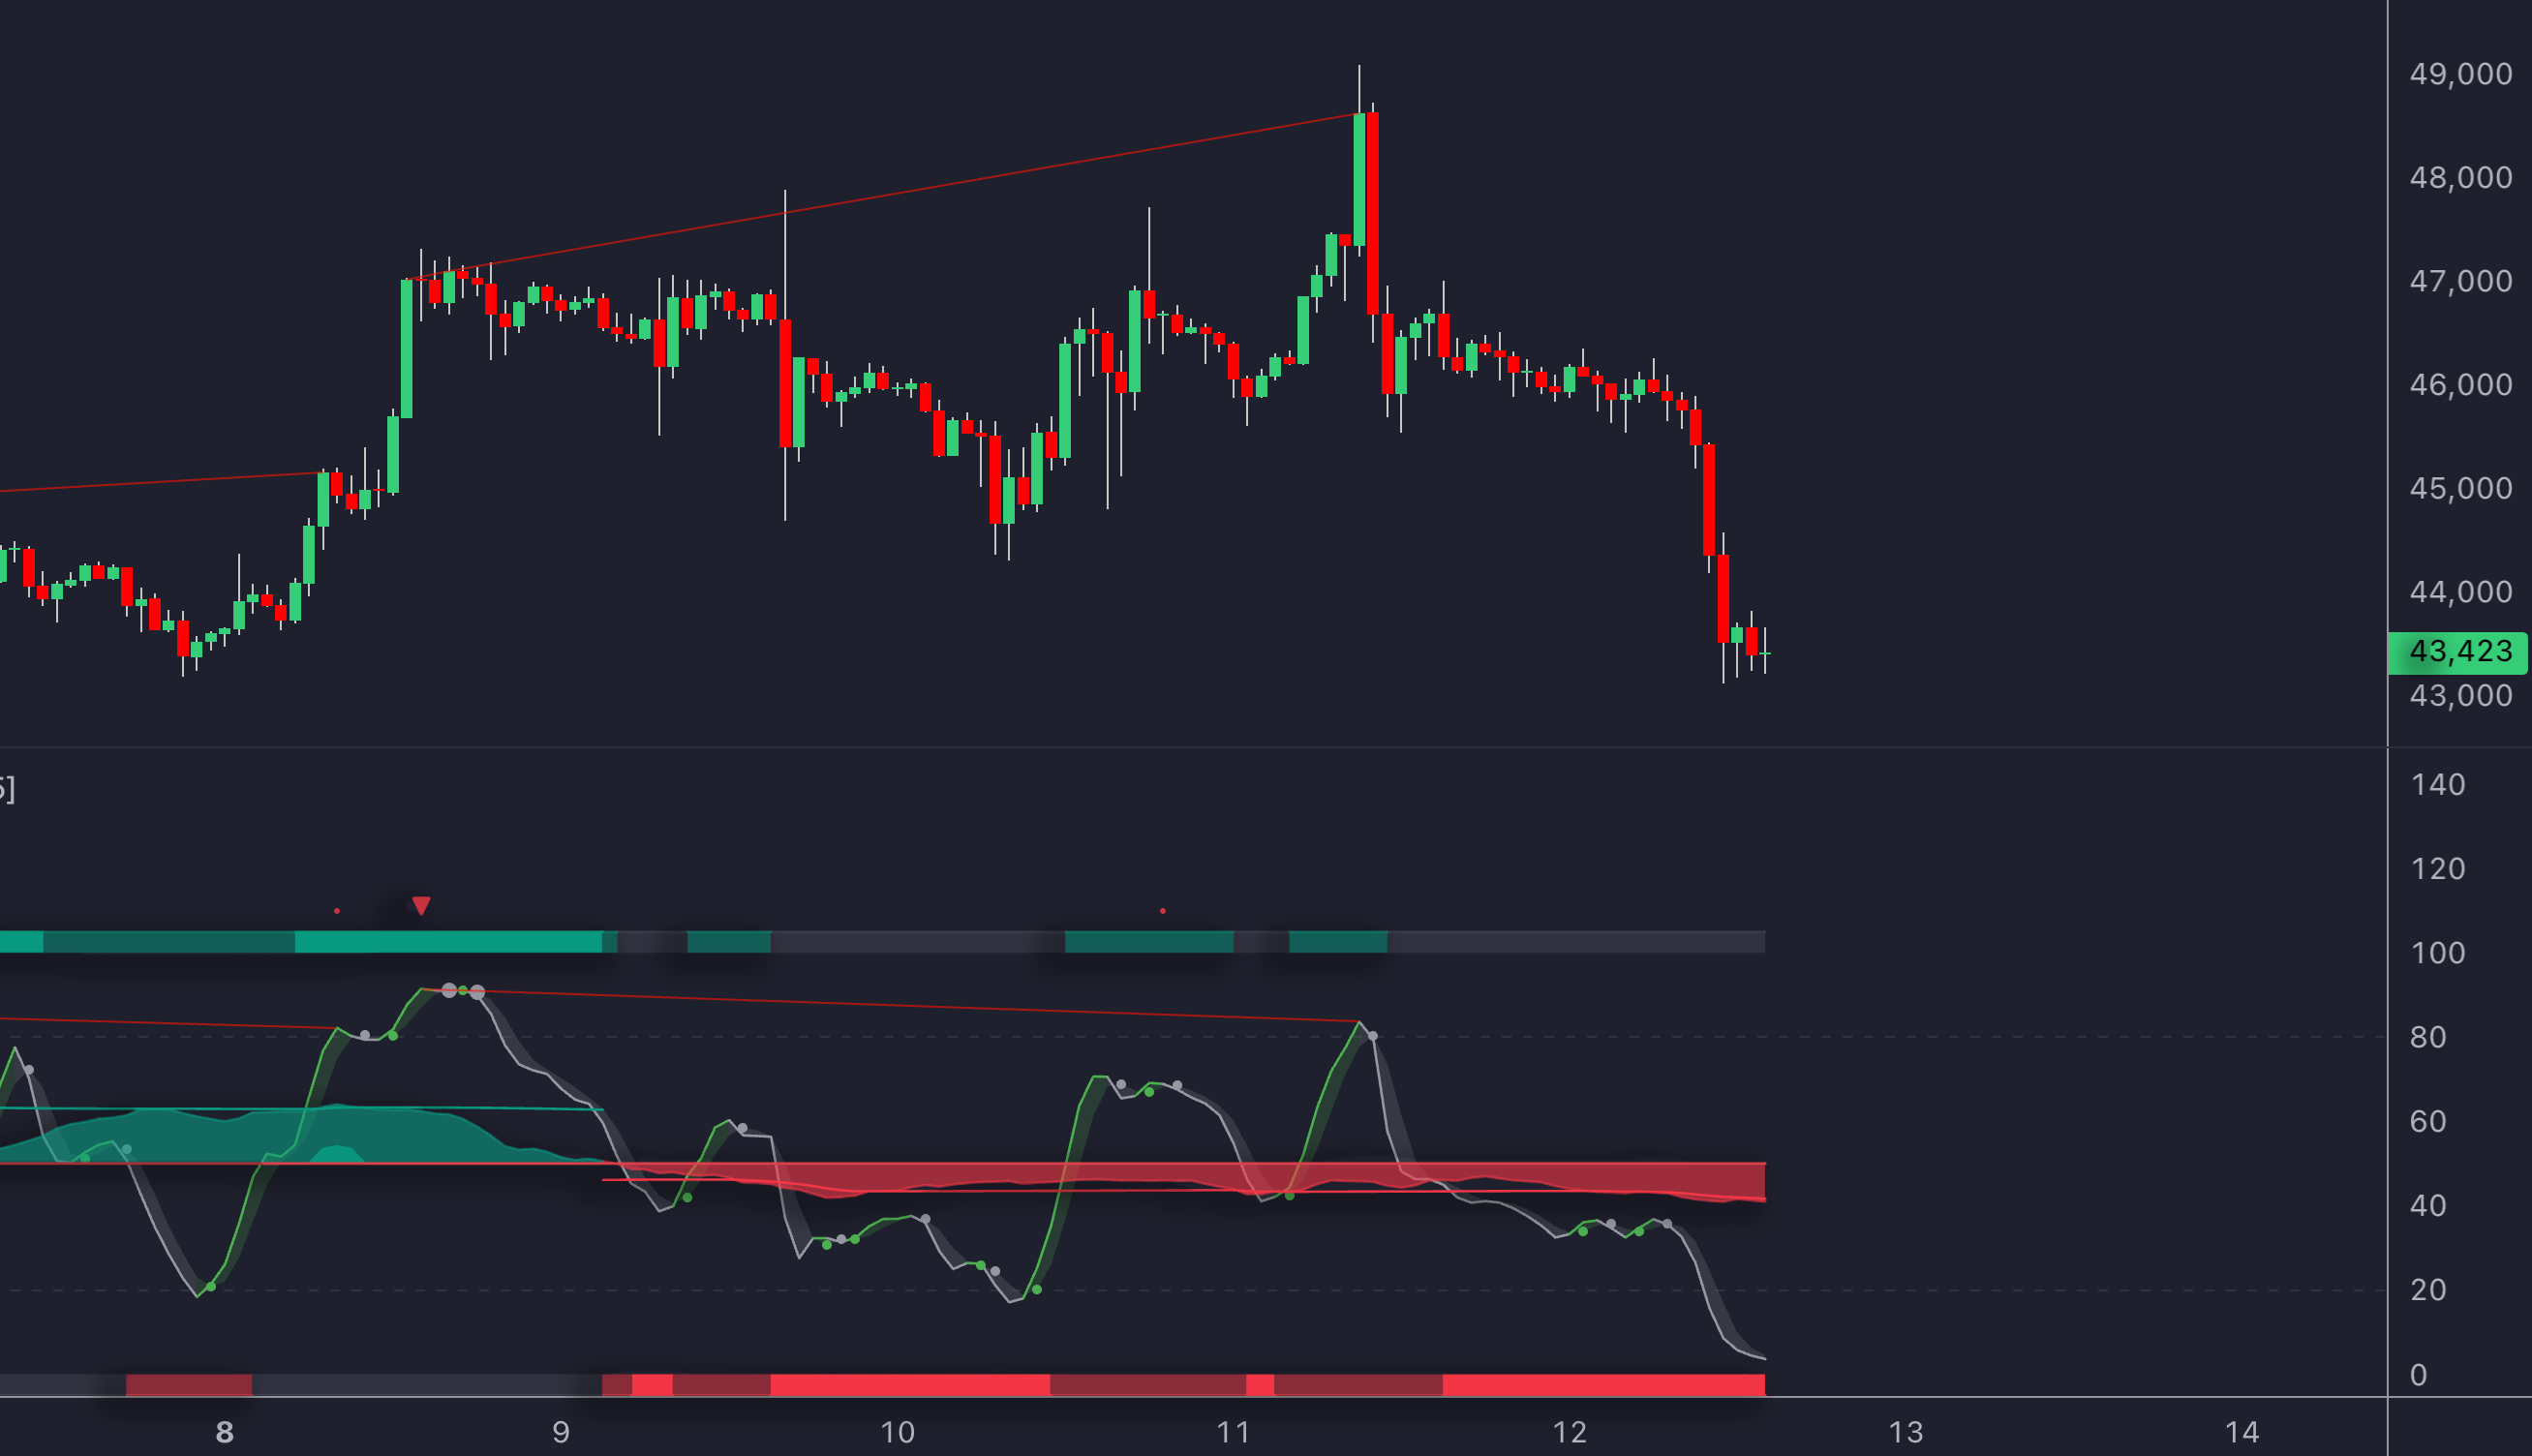
The Oscillator Matrix® is a comprehensive, multi-component indicator that not only detects trend reversals but also provides powerful momentum analysis. By integrating over 6 unique components, it delivers real-time signals that help traders gauge both the strength and the speed of market movements.
This indicator systematically blends various analytical elements to highlight periods of accelerated momentum and identify early signs of momentum fading. Whether it’s detecting a surge in buying power or flagging a slowdown before a reversal, the Oscillator Matrix® equips traders with a robust framework for dynamic momentum evaluation.
Traders can customize its settings to focus on key momentum metrics—such as rapid price acceleration or deceleration—and combine these insights with other tools like RSI or Moving Averages for a more nuanced analysis. In this way, the Oscillator Matrix® serves as both a standalone solution and a complementary asset for enhancing momentum-based trading strategies.
5. MACD (Moving Average Convergence Divergence)
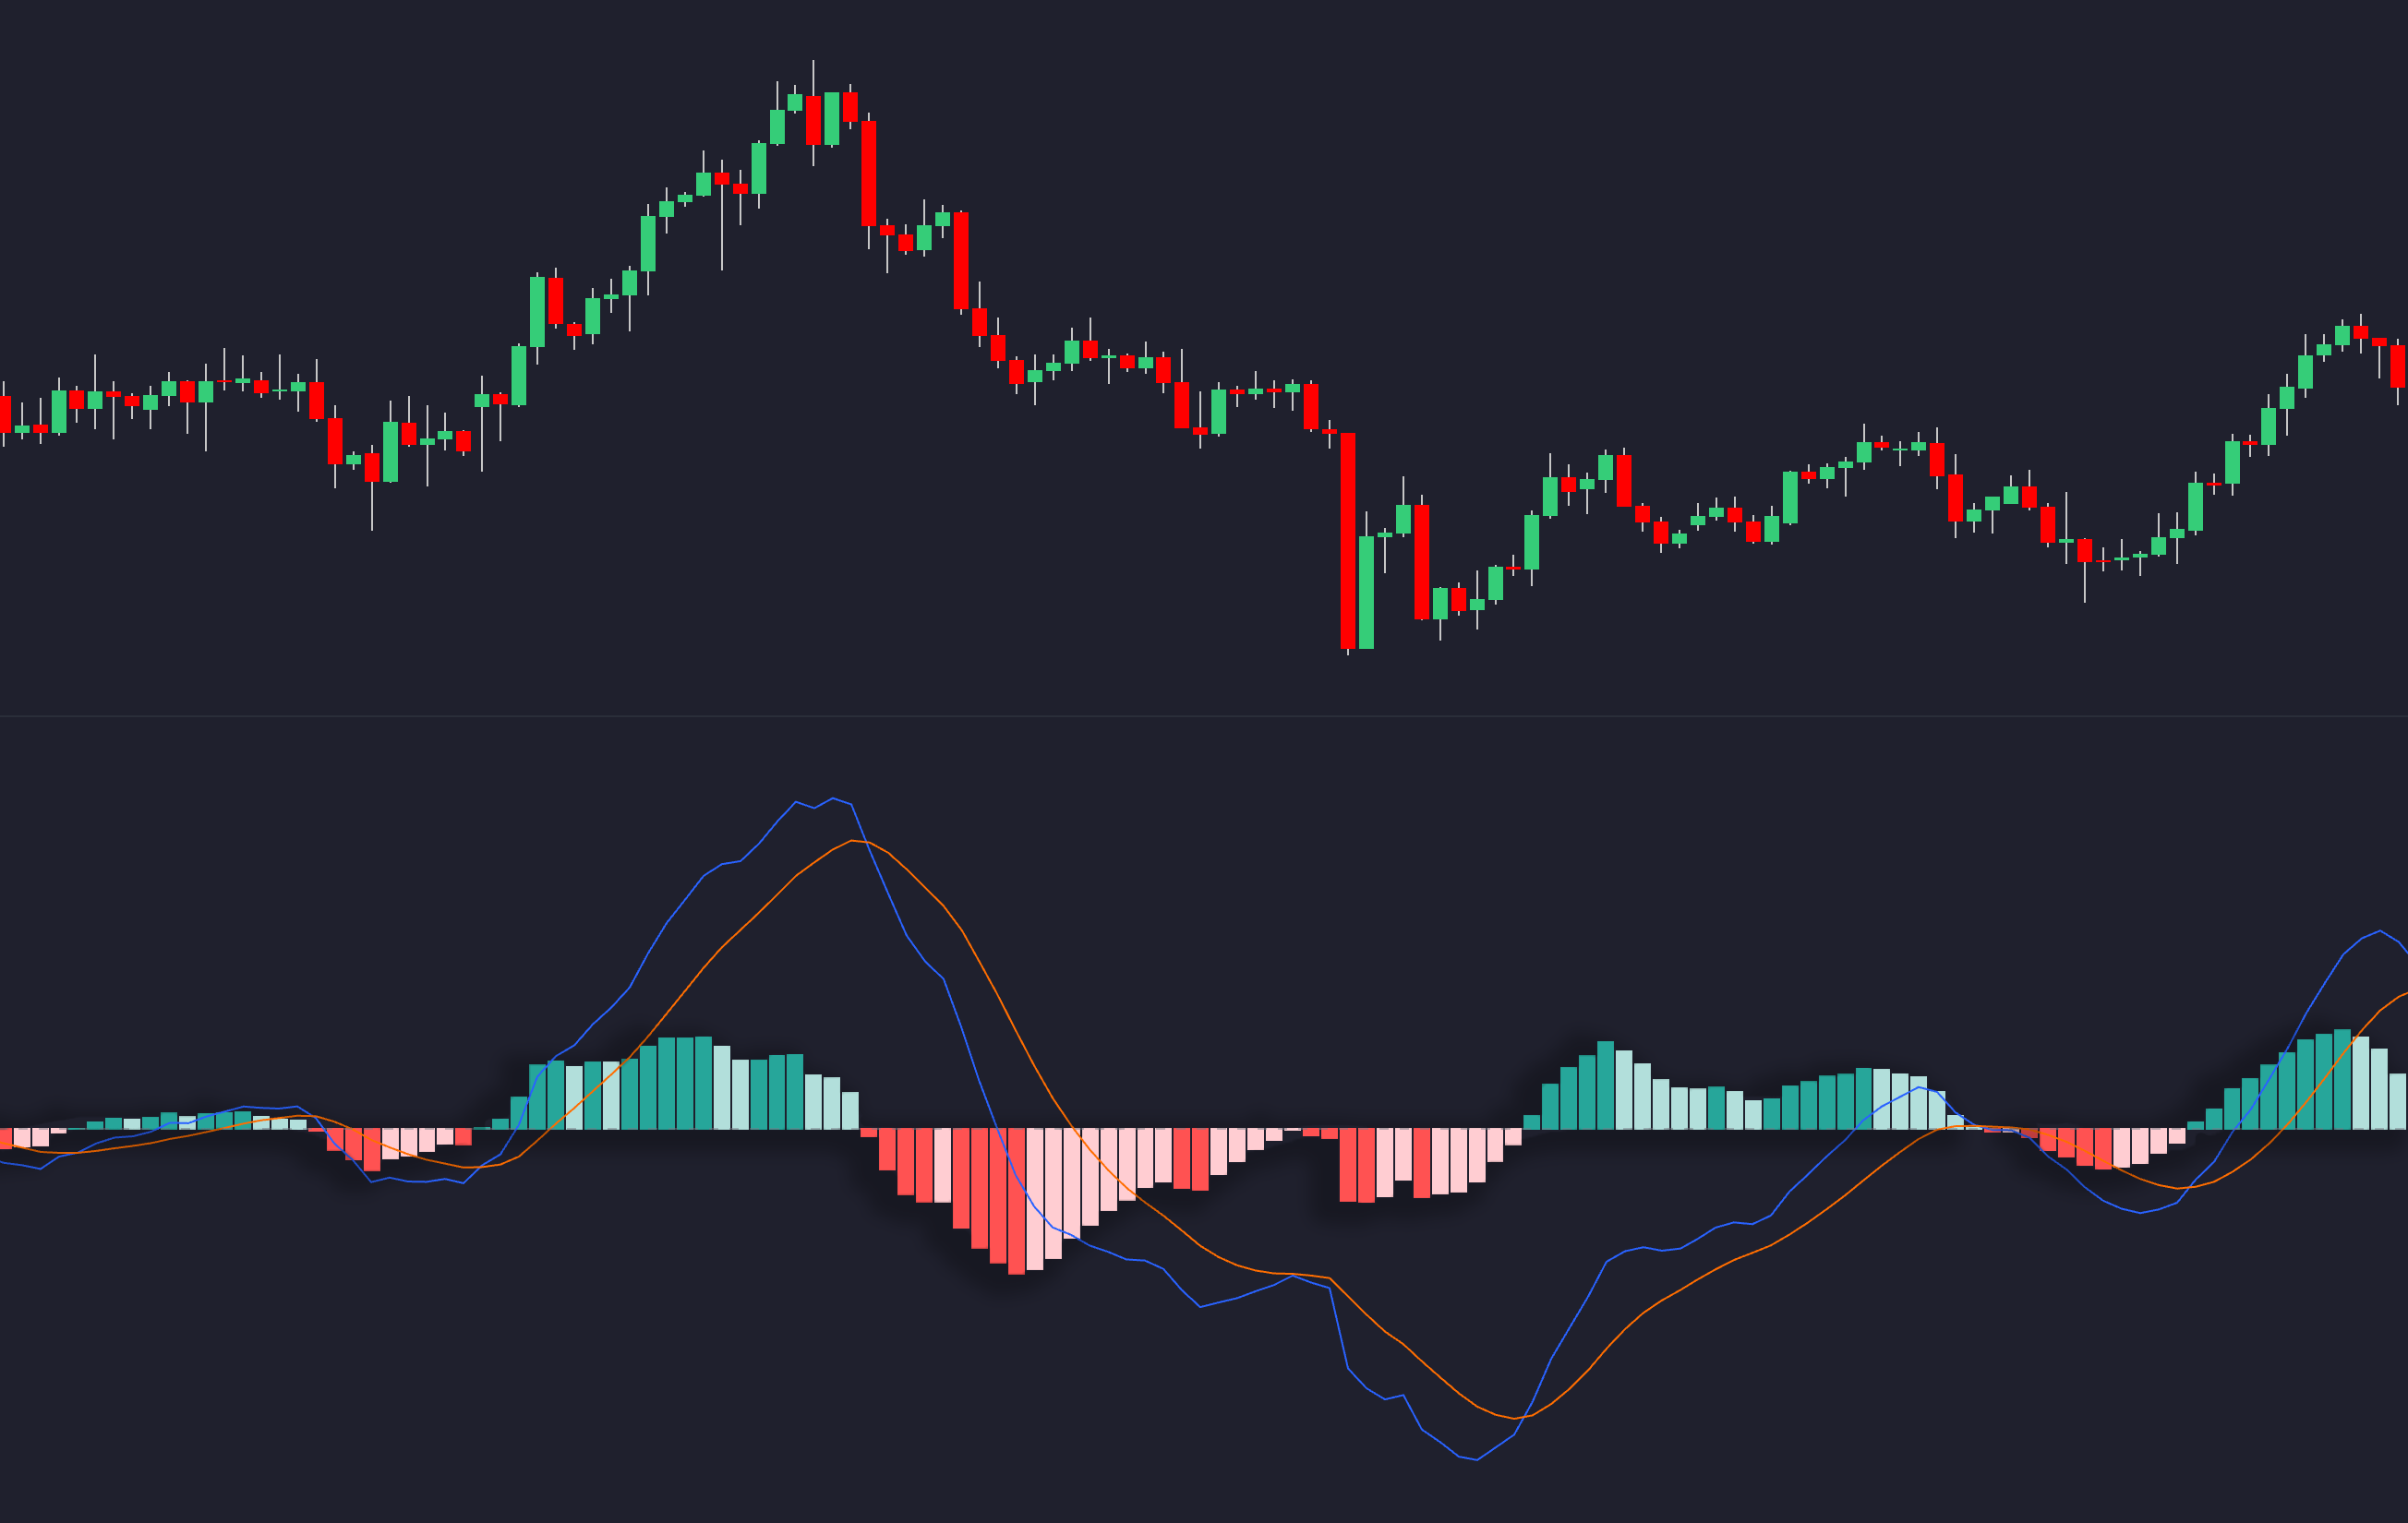
The MACD is a popular momentum indicator on TradingView. It is calculated by subtracting the 26-period EMA from the 12-period EMA, with a 9-period EMA serving as the signal line.
MACD generates momentum signals through:
| Signal Type | Description | Trading Implication |
|---|---|---|
| Crossovers | MACD line moves above or below the signal line | Potential entry or exit points |
| Divergences | MACD trend diverges from price action | Possible trend reversals |
| Histogram | Represents the gap between MACD and the signal line | Indicates momentum strength |
TradingView enhances MACD with customizable alerts, backtesting tools, and adjustable visuals, allowing traders to fine-tune settings across different timeframes.
Tips for Using MACD Effectively:
- Use higher timeframes to confirm overall trends while looking for entry signals on lower timeframes.
- Combine MACD with other indicators for a more comprehensive analysis.
- Adjust parameters to align with your trading style and prevailing market conditions.
MACD is most effective in trending markets but can produce misleading signals during sideways movements. Its integration with volume analysis and price action patterns makes it a valuable component for refining trading strategies.
Comparison of Momentum Screening Tools
When choosing momentum screening indicators on TradingView, understanding their unique features can help traders make informed decisions. Here's a quick comparison of their strengths and limitations:
| Tool | Primary Function | Best Use Case | Limitations | Signal Speed & Accuracy |
|---|---|---|---|---|
| Momentum Indicator (MOM) | Tracks price momentum changes | Short-term trading | Can mislead in volatile markets | Medium |
| RSI | Highlights overbought/oversold conditions | Spotting trend reversals | Sensitive to settings | High |
| Moving Averages | Shows trend direction and strength | Following long-term trends | Reacts slowly | Medium |
| Oscillator Matrix® | Combines multiple components for comprehensive analysis | Systematic momentum and trend detection | Learning curve with many components | Very High |
| MACD | Measures trend strength and changes | Confirming trends | Less effective in sideways markets | Medium |
Each indicator plays a specific role depending on market conditions and trading styles. While classic tools like RSI and Moving Averages remain reliable, the Oscillator Matrix® introduces a multifaceted approach that leverages modern techniques for sharper momentum signals.
Key Performance Factors:
The Oscillator Matrix® stands out by integrating multiple components that work together to minimize false signals and deliver robust trend and momentum insights.
Practical Application:
Many traders combine indicators for optimal results. For example, pairing the Oscillator Matrix® with RSI can help refine entry and exit points, reducing the risk of false signals while enhancing overall strategy accuracy.
When building your momentum strategy, weigh the pros and cons of each tool to create a balanced approach that incorporates both traditional analysis and modern, integrated insights.
Conclusion
Momentum screening indicators play a crucial role in navigating today's dynamic markets. By blending traditional tools with advanced, multi-component indicators like the Oscillator Matrix®, traders can achieve deeper insights and improved accuracy in their analyses.
While classic indicators remain dependable, integrating modern systems helps minimize false signals and refine overall decision-making. A balanced strategy that combines technical analysis with systematic tools is key to staying ahead in volatile market conditions.
Tips for Effective Momentum Screening:
- Regularly backtest strategies and adjust parameters
- Use a combination of indicators to confirm signals
- Adopt strict risk management practices
- Stay flexible and adapt to evolving market trends
The key to successful momentum screening lies in blending proven techniques with innovative technology, ensuring a comprehensive approach to market analysis.
FAQs
What is the most accurate momentum indicator?
The accuracy of momentum indicators depends on market conditions and your trading strategy. Rather than relying on a single tool, combining multiple indicators often yields better insights. Here's a quick comparison:
| Indicator | Strength | Best Use |
|---|---|---|
| RSI | Detects quick reversals | Short-term trades |
| ADX | Measures trend strength | Identifying robust trends |
| MACD | Confirms momentum shifts | Multi-timeframe analysis |
| CCI | Highlights price deviations | Mean reversion strategies |
| MOM | Tracks immediate shifts | Rapid market changes |
The Relative Strength Index (RSI) is particularly useful for short-term trades due to its straightforward signals. To boost accuracy:
- Match indicators to your trading timeframe
- Adjust settings based on asset volatility
- Factor in current market conditions
For a more advanced approach, combining the Oscillator Matrix® with traditional indicators can refine entry and exit points, helping traders navigate market shifts with greater precision.