Learn how to enter trending markets with trendline pullback trading, improving your timing and reducing risk through effective analysis.
Want to trade with better timing and lower risk? Trendline pullback trading helps you enter trending markets during retracements, increasing your chances of success. Here's what you'll learn in this guide:
- What is a trendline pullback? A price retracement to a trendline before continuing the trend.
- Why use trendlines? They simplify trend analysis, define entry points, and improve risk control.
- How to validate pullbacks: Combine price action, technical indicators (like RSI), and volume analysis.
- Entry methods: Use limit, market, or stop orders based on confirmation signals.
- Advanced tools: Incorporate Fibonacci levels, liquidity trendlines, and multi-timeframe analysis for precision.
Ready to refine your trading strategy? Dive into the guide for detailed steps, examples, and the most effective techniques to master trendline pullback entries.
Trading Trendlines - The Complete Guide
Preparation Steps
Getting ready for trendline pullback trading means focusing on accurate trendline drawing and leveraging advanced technical tools on TradingView to refine your analysis.
Drawing Effective Trendlines
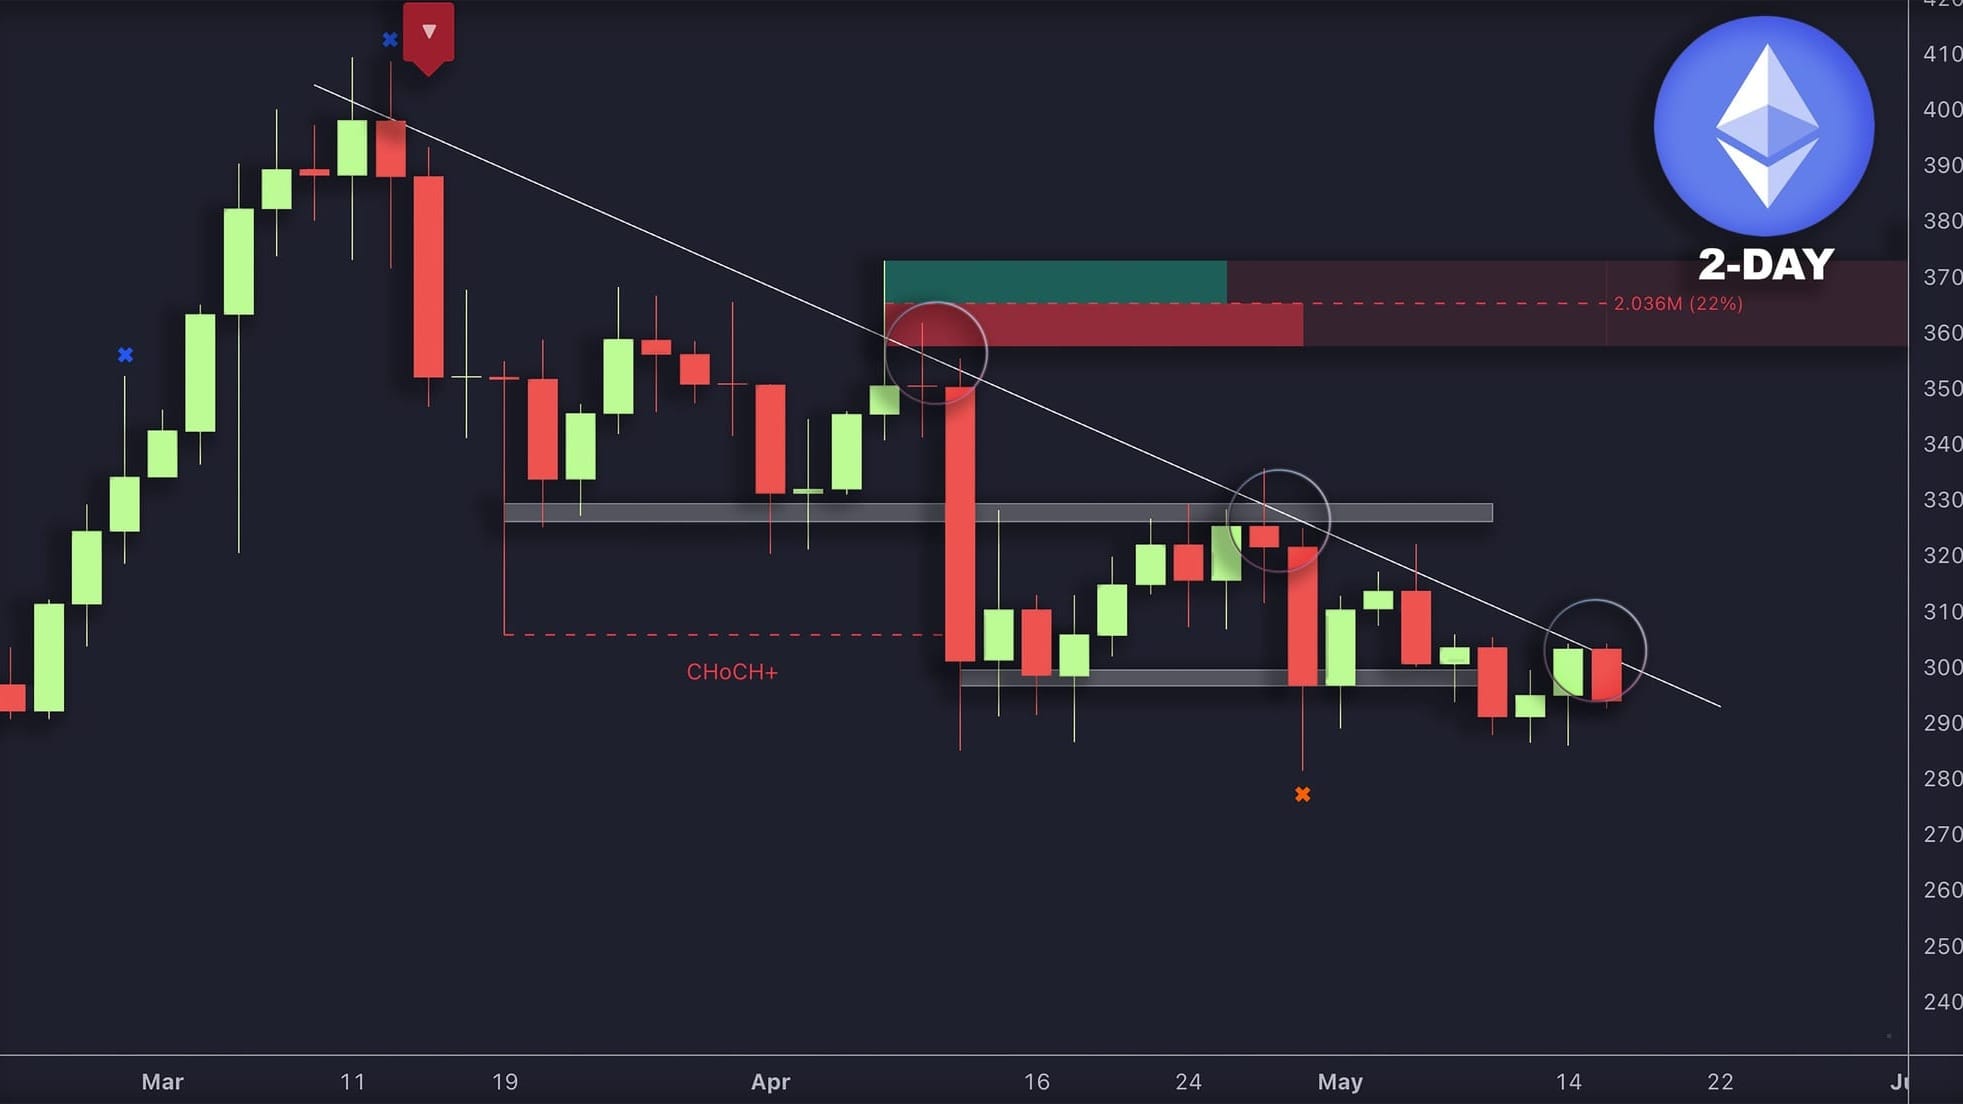
To be valid, a trendline should connect at least three swing points without cutting through price action. It should align naturally with the market's slope and highlight areas where prices are likely to interact in the future.
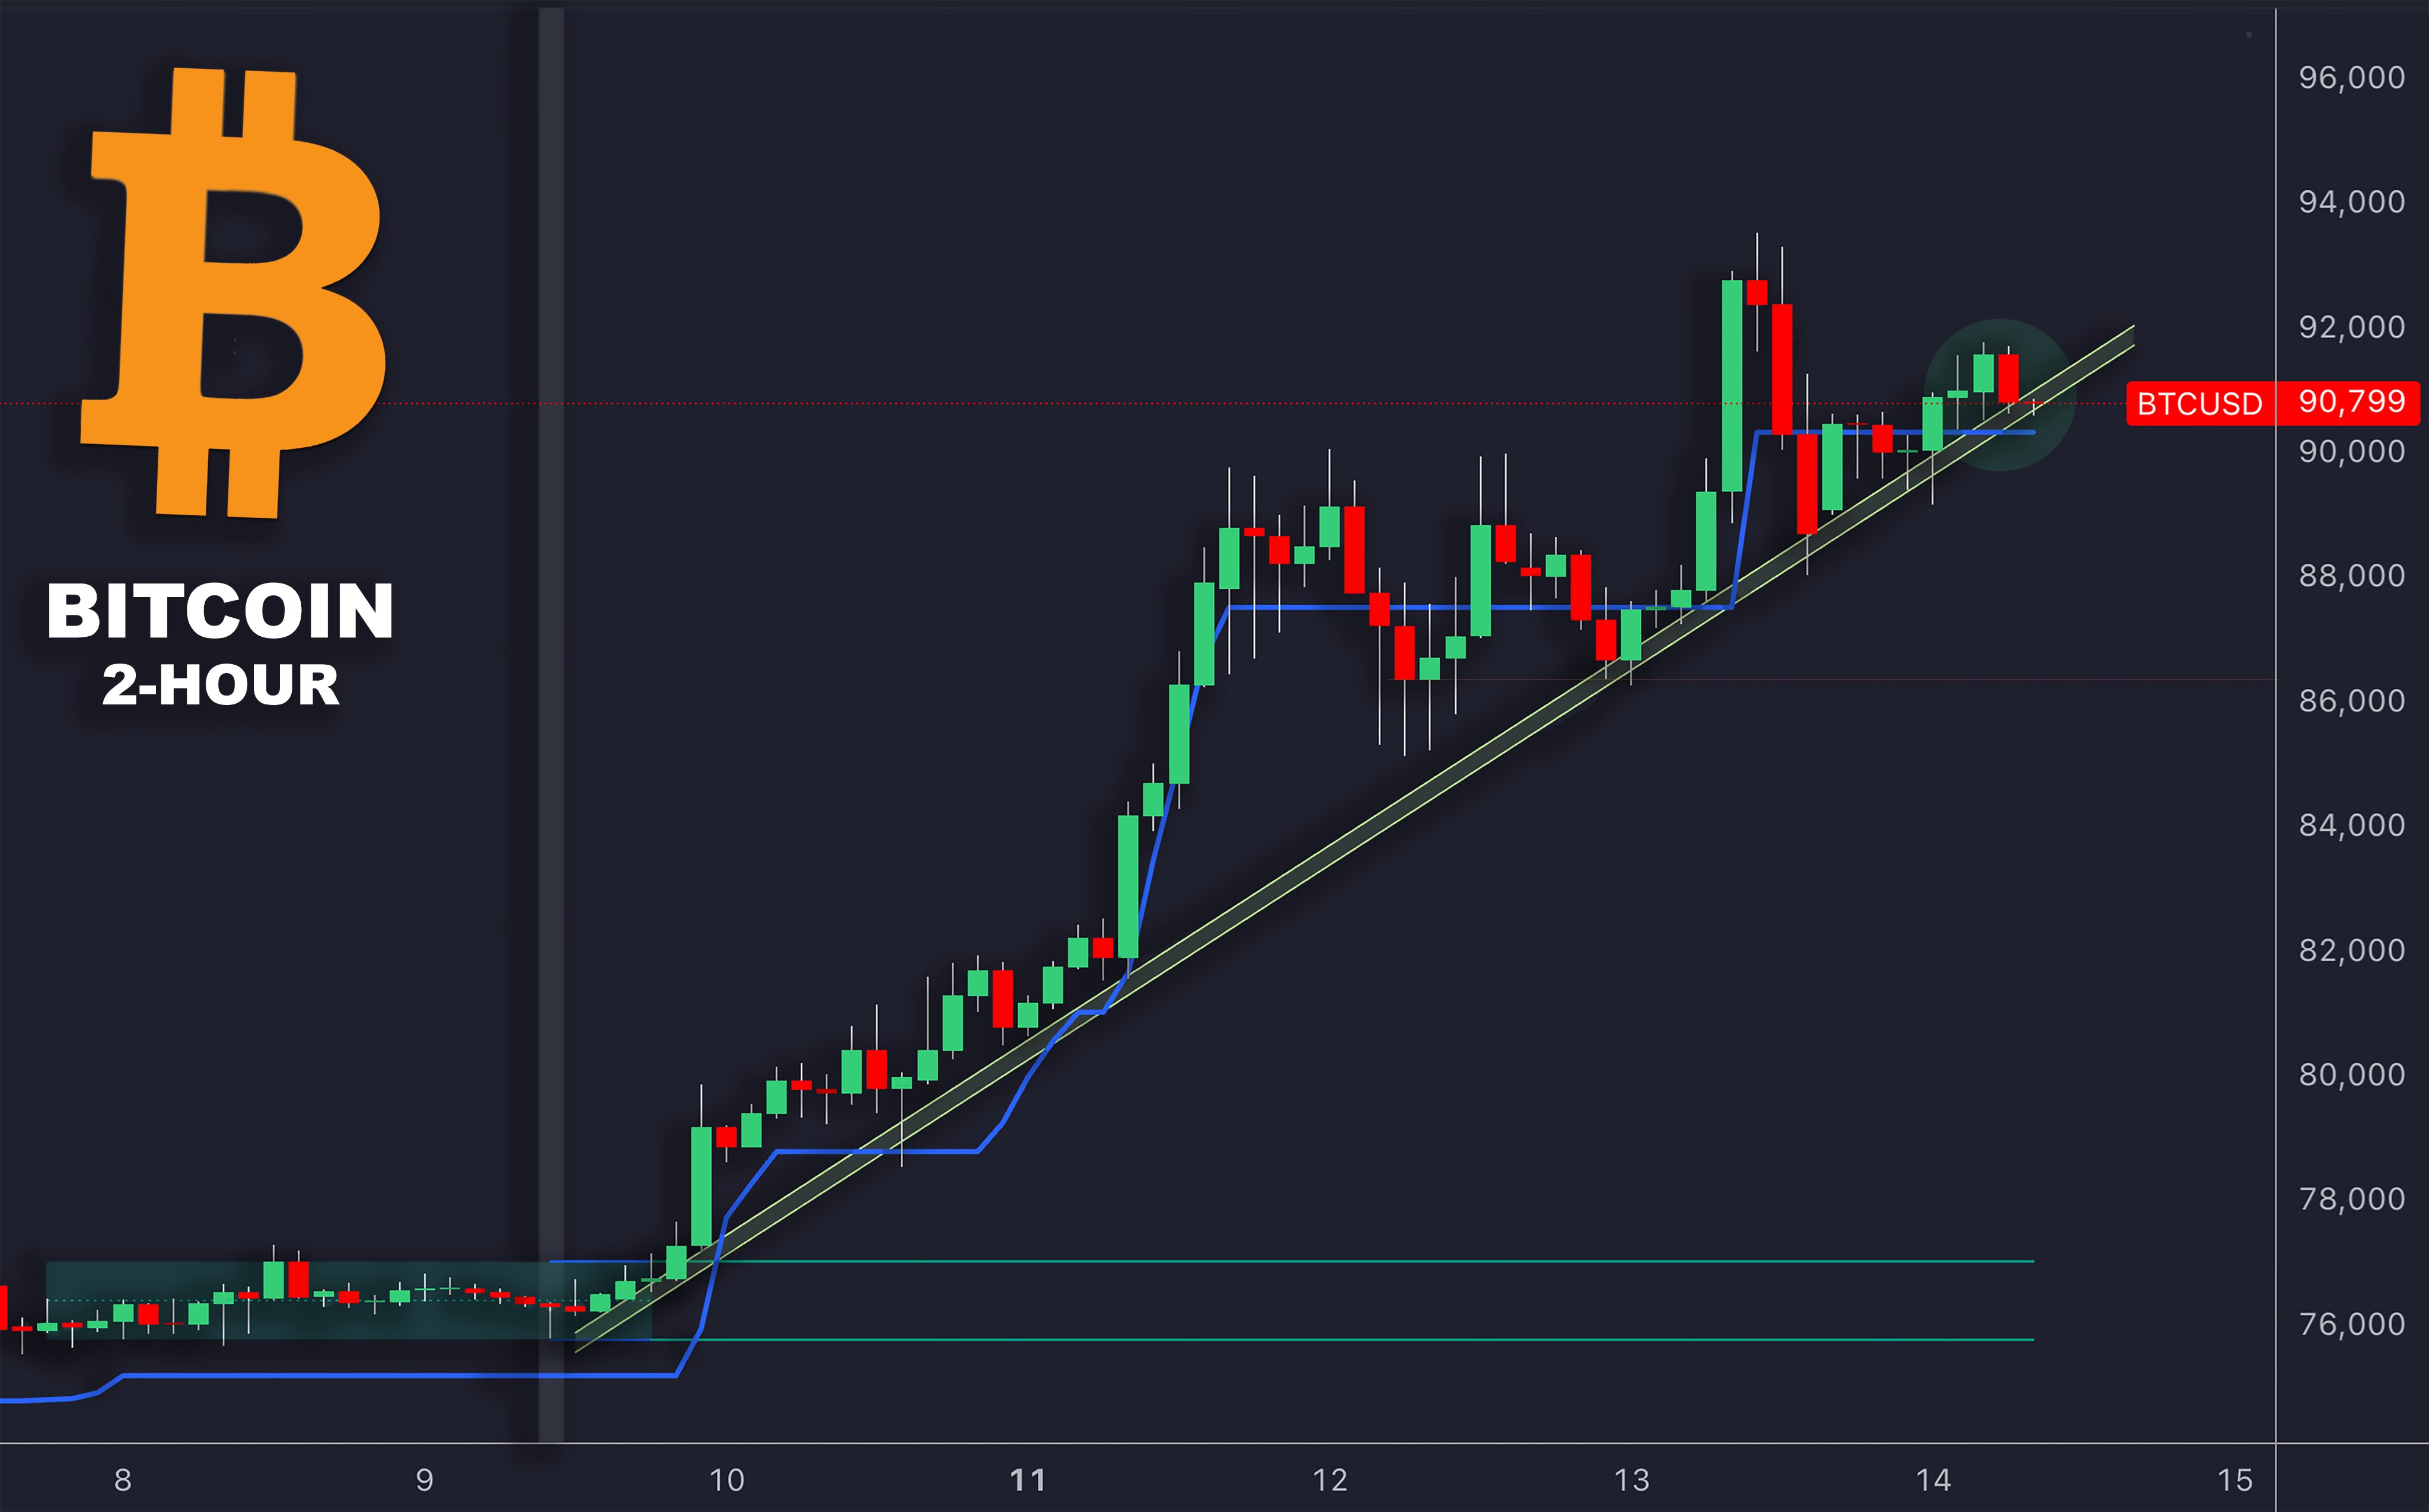
Pullback trades often work best on the fourth or fifth touch of a trendline [3]. Stick to trendlines that show a clear directional movement and consistent price swings to increase the likelihood of a successful setup.
Once you've validated your trendlines, you can use them as a foundation for further analysis with technical tools.
Using Technical Tools
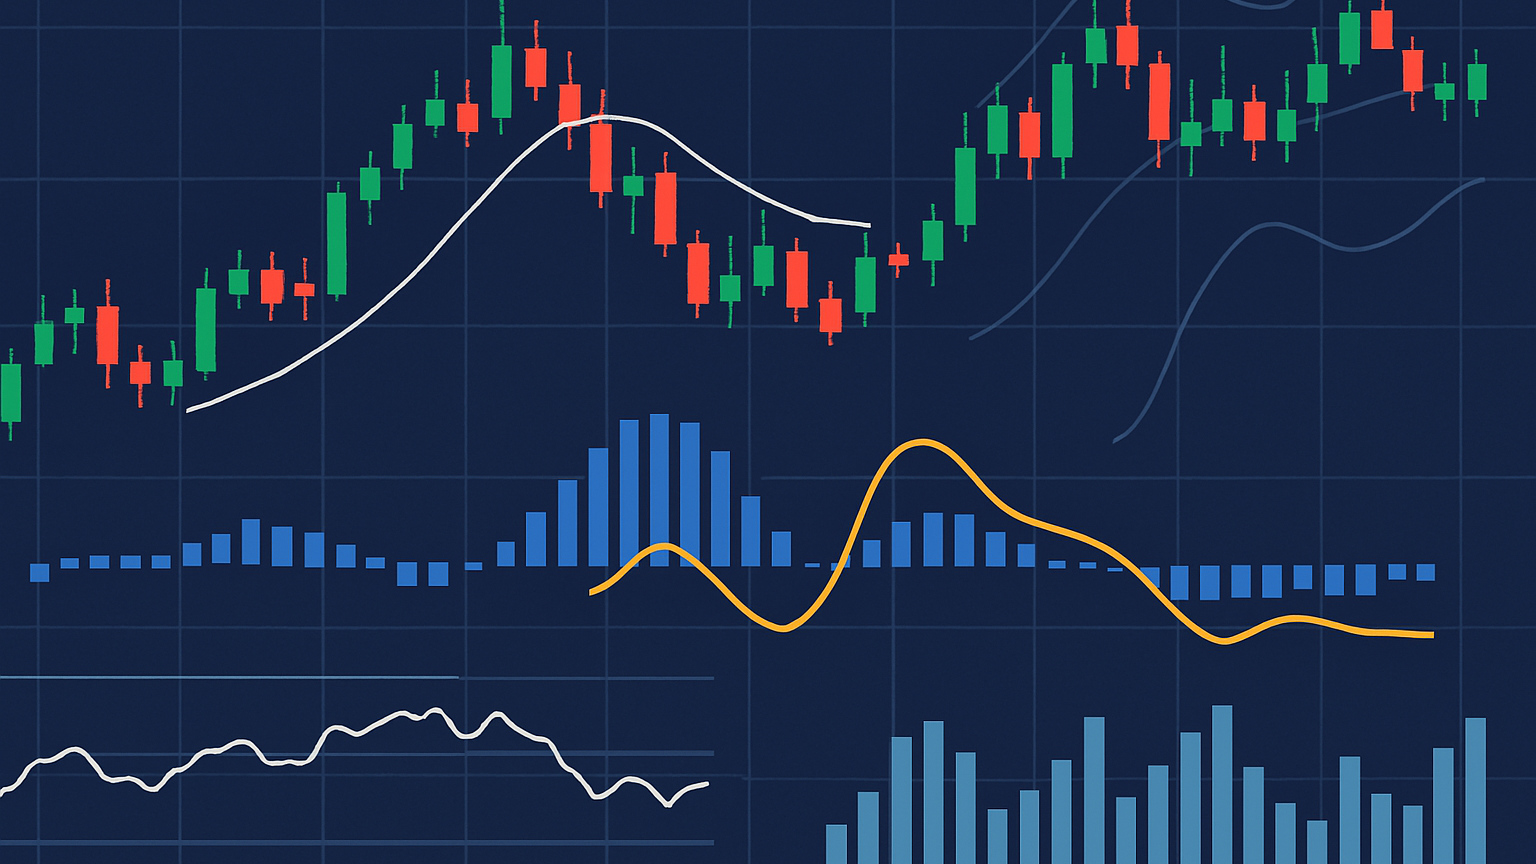
Advanced tools can simplify and improve your analysis. For example, on TradingView, LuxAlgo provides hundreds of free trading indicators along with exclusive tools that automatically detect trendlines and deliver detailed price analysis, saving you time and effort.
| Tool | What It Does | How to Use It |
|---|---|---|
| Volume Profile | Highlights areas of high activity | Confirms the strength of support/resistance |
| Multiple Timeframes | Shows trends across different periods | Ensures alignment with the overall trend |
| Order Blocks | Marks key trading zones | Identifies potential reversal points |
When applying these tools, look for setups where multiple indicators confirm the trend. For instance, prioritize situations where a trendline touch aligns with a volume spike and supports the trend across several timeframes.
Steer clear of common errors like forcing trendlines to match your expectations or ignoring broader market conditions. Let the price action dictate your trendlines and always verify your findings with multi-timeframe analysis for a solid setup.
Pullback Validation
Validating pullbacks involves combining price action signals, technical indicators, and volume analysis to assess the likelihood of a trend continuing.
Price Action Signals
Price action offers the quickest way to confirm a pullback. Look for specific candlestick patterns forming at trendlines (drawn as per earlier steps) that suggest a potential reversal. Patterns like hammer candles and engulfing patterns are especially reliable since they indicate strong rejections of price levels.
For bullish pullbacks in uptrends, focus on:
- Hammers with long lower wicks
- Bullish engulfing patterns covering 2-3 candles
- Rejection pin bars
The placement of these patterns is crucial. A hammer forming right at the trendline carries more significance than one slightly off the mark.
Once price patterns are identified, confirm them with technical indicators.
Indicator Support
Technical indicators provide an additional layer of validation. The Relative Strength Index (RSI) is particularly useful for confirming pullback entries.
| Indicator | Bullish Signals | Bearish Signals |
|---|---|---|
| RSI | Below 30 (oversold) | Above 70 (overbought) |
| Divergence | Higher lows on RSI | Lower highs on RSI |
Tools like LuxAlgo's Oscillator Matrix simplify this process by automatically detecting these confluences, helping you spot setups where multiple factors align.
Volume Confirmation
Volume analysis reveals the strength of a pullback and its potential reversal. A healthy pullback often shows declining volume during the retracement, followed by a volume spike at key levels like trendlines [4].
Key volume patterns to watch for:
- Falling volume during the retracement phase
- Volume spikes when price touches the trendline
- Above-average volume on reversal candles
When you spot a hammer at the trendline, oversold RSI, and a volume spike, you’ve likely identified a high-probability setup. These validated setups pave the way for precise entry execution, which will be discussed next.
Trade Entry Methods
When deciding on entry methods, consider both market volatility and the strength of confirmation signals.
Entry Types and Timing
| Entry Type | Best Used When | Characteristics |
|---|---|---|
| Limit Order | Price approaches a clear trendline | Offers a better price but risks missing the move |
| Market Order | Strong confirmation signals are present | Ensures immediate execution but carries slippage risk |
| Stop Order | Price consolidates near a trendline | Confirms the trend but results in a later entry |
Tip: Use the LuxAlgo Toolkits to identify zones where multiple confirmation factors align.
For market orders, wait for the candle to close beyond the trendline before entering.
Risk Control Rules
Once you've selected an entry method, follow these risk management steps:
-
Risk 1-2% of your account balance per trade. Use this formula to calculate position size:
Position Size = (Account Balance × Risk Percentage) / (Stop Loss Distance × Value Per Pip) -
Place stop losses based on the Average True Range (ATR):
- For long trades: Set the stop 2 × ATR below the entry point
- For short trades: Set the stop 2 × ATR above the entry point
Avoid trades that don't meet your risk criteria.
Advanced Methods
Fibonacci Analysis
Fibonacci retracements take trendline analysis to the next level by pinpointing precise pullback levels. These retracements, particularly between the 38.2% and 61.8% levels, have been shown to improve pullback success rates. A 15-year study revealed that combining Fibonacci levels with trendlines led to a 12% higher win rate compared to using trendlines alone [1]. These levels are most effective when they align with your existing trendline.
| Fibonacci Level | Importance | Best Use |
|---|---|---|
| 38.2% | Indicates a shallow pullback | Signals quick trend continuation |
| 50.0% | Represents a moderate retracement | Suggests balance between buyers and sellers |
| 61.8% | Marks a deep pullback | Confirms strong trend momentum |
Liquidity Trendlines
Liquidity trendlines are an advanced concept that identifies zones where liquidity tends to accumulate—often due to clusters of stop-loss orders or large market positions. These trendlines are drawn along significant price levels and visually connect areas of concentrated liquidity, offering insight into potential breakouts or reversals.
By incorporating liquidity trendlines into your analysis, you can better anticipate surges in market activity or shifts in momentum. This approach complements traditional trendline analysis and can be especially powerful when used alongside tools like Fibonacci retracements.
For more details on how liquidity trendlines work and how to apply them, refer to LuxAlgo’s Liquidity Trendlines documentation.
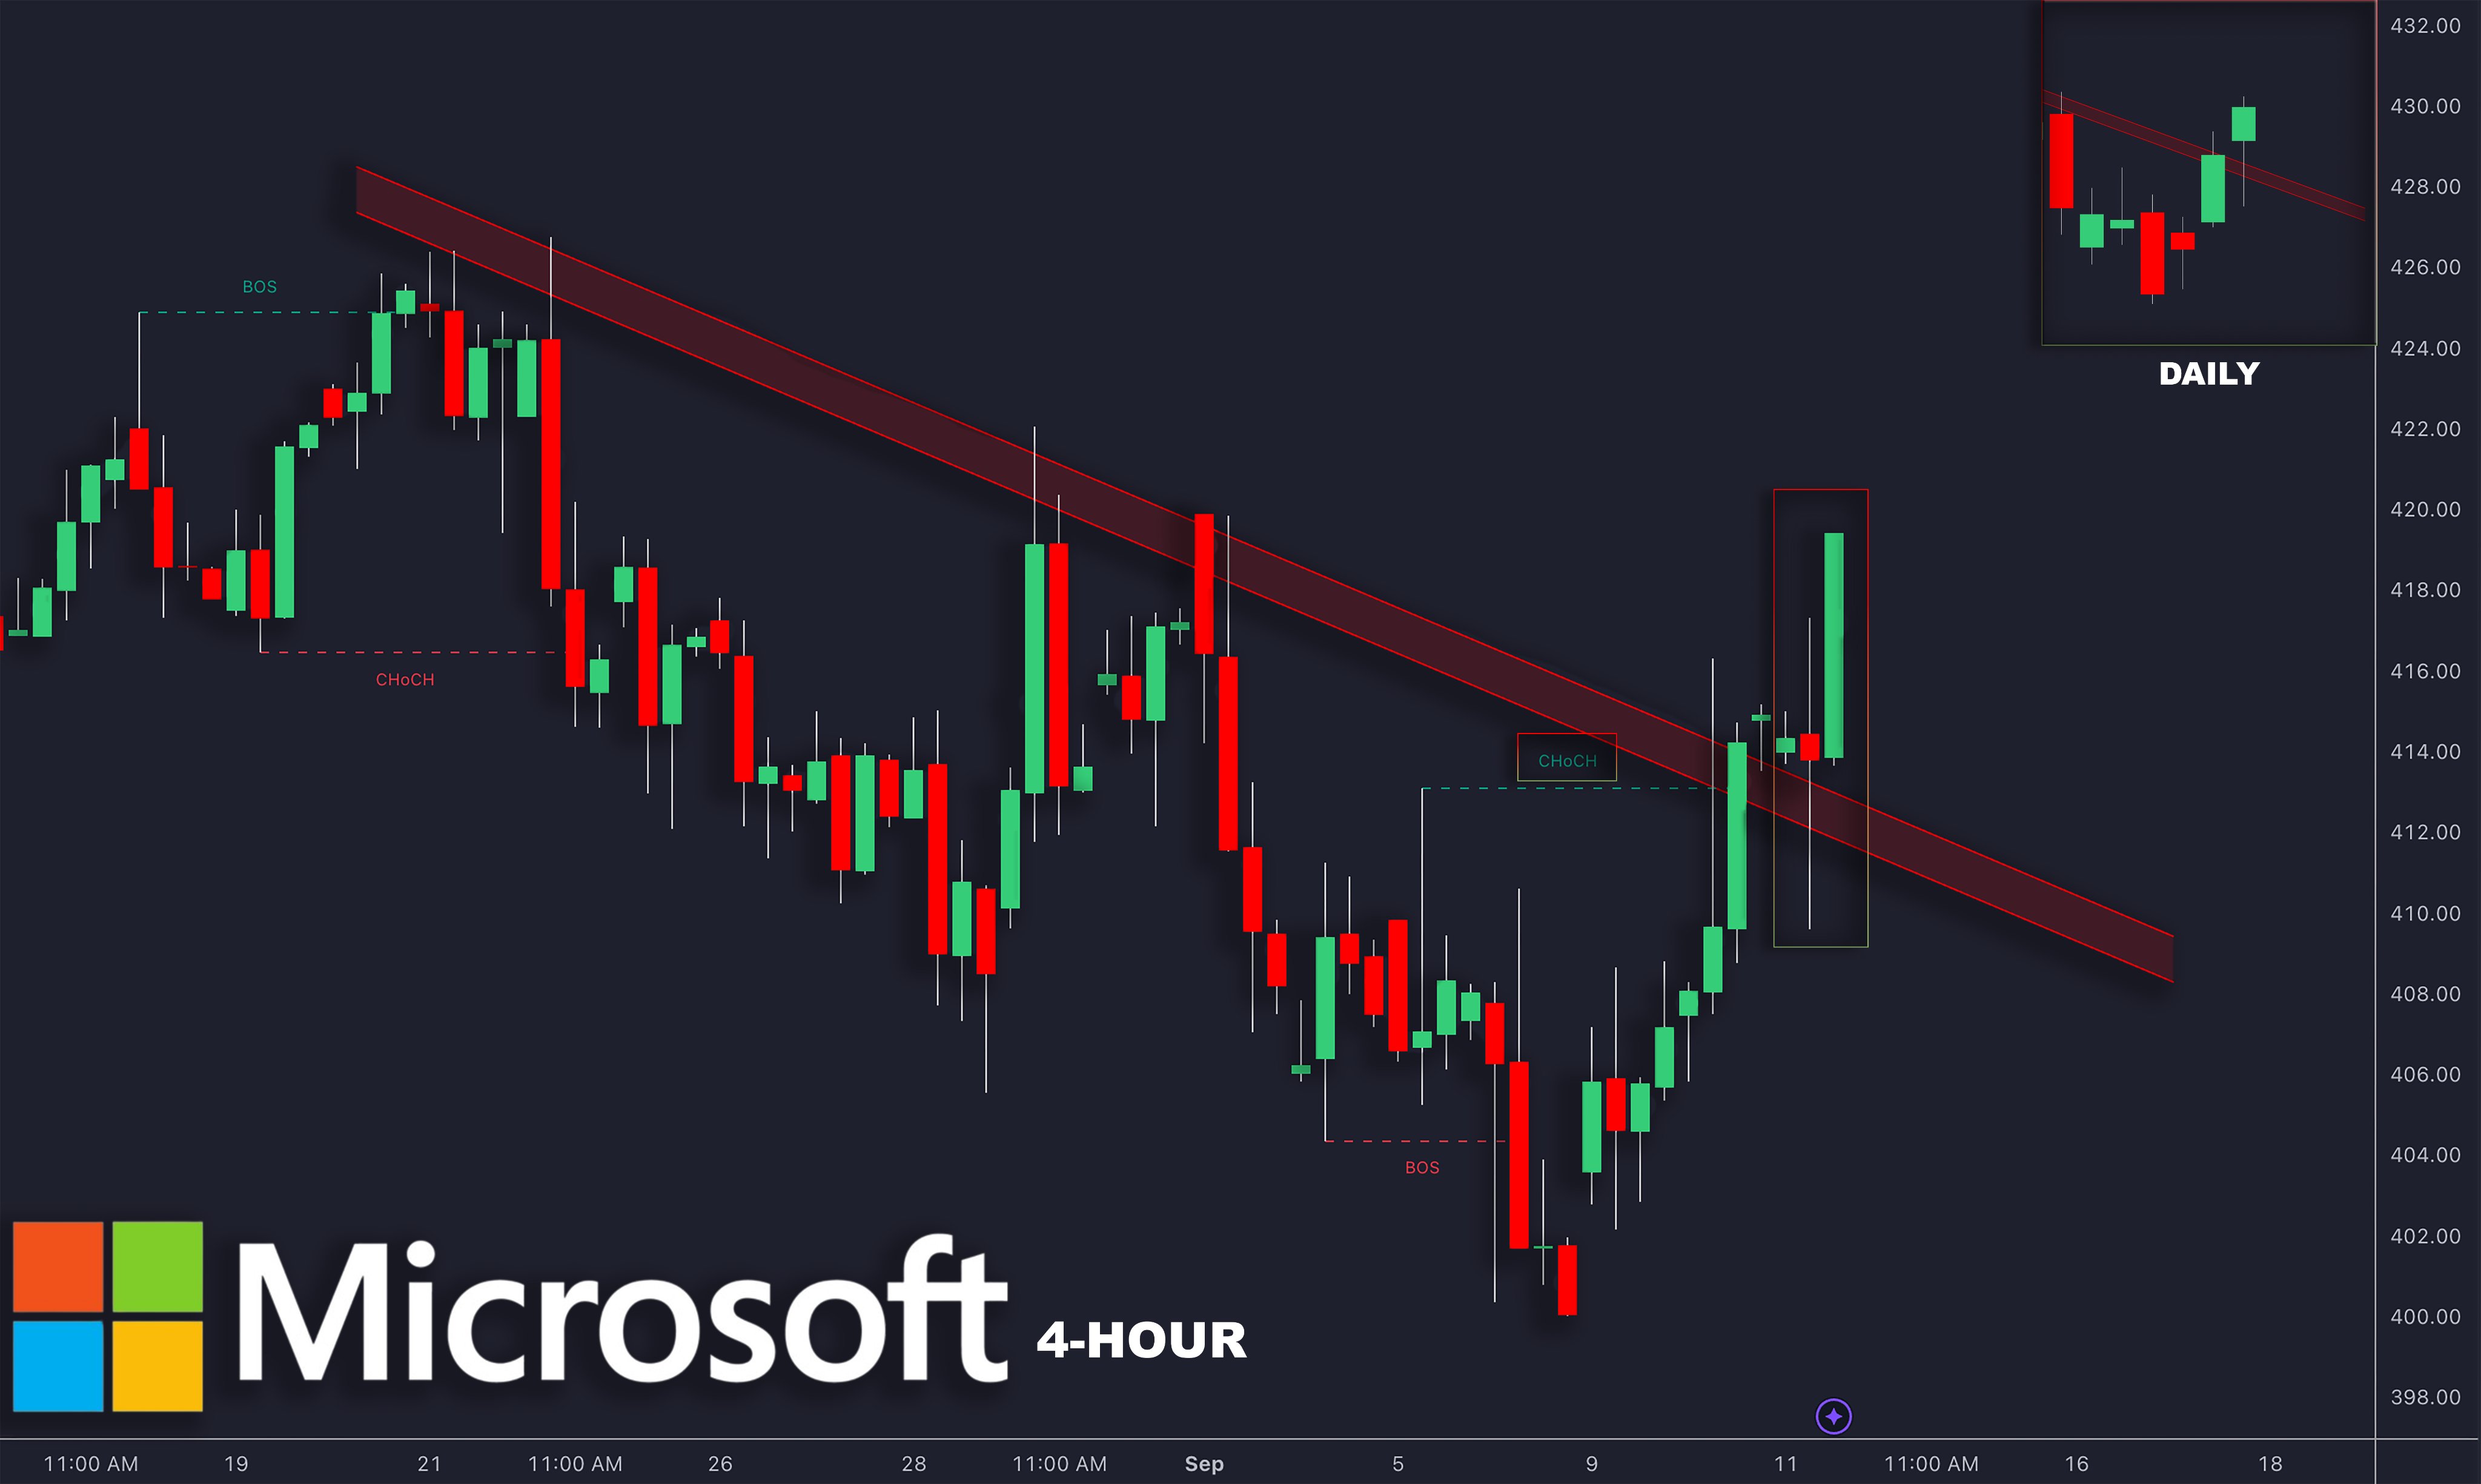
Timeframe Analysis
Multi-timeframe analysis is critical for refining pullback trades. A 4-hour chart is ideal for precise entries, while the daily timeframe confirms the overall trend direction.
When working across timeframes, focus on these aspects:
- Look for multiple support signals on the lower timeframe
- Match volume patterns with pullback phases
For example, if the daily chart shows a clear uptrend supported by a trendline, switch to the 4-hour chart to identify entry points at the trendline. This method reduces market noise and highlights high-probability setups [2].
LuxAlgo's Trend Analysis Toolkit can be particularly helpful here. Use it to draw accurate trendlines and overlay the Volume Profile, ensuring pullback levels align with high-volume zones for added confirmation [2][3].
Conclusion
We've gone through validation methods and advanced techniques, so let's pull together the key elements for successful trendline pullback trading.
Core Components for Success
The technical elements we've covered can work together to create a dependable trading framework. Here are the essentials:
- Valid Trendlines: Ensure they are confirmed across multiple timeframes.
- Multi-Factor Confirmation: Look for several signals before entering a trade.
Key Focus Areas
To improve your results, pay attention to these:
- Multi-Level Analysis: Combine price action, indicators, and volume analysis for a well-rounded view.
- Timeframe Alignment: Make sure your entries align with the bigger market picture.
Getting Started
Ready to put this into action? Start with demo accounts to build confidence. Focus on major currency pairs or high-volume stocks since they often show cleaner trends. Leverage the exclusive tools and free trading indicators offered by LuxAlgo to pinpoint important market structures.
Here are a few tips for success:
- Practice on demo accounts to refine your approach.
- Use the 2×ATR stop-loss method discussed earlier.
- Stick to high-volume, trending markets for better clarity.