Learn how to enhance your trading accuracy with continuation patterns and indicators for spotting trend continuations.
Continuation patterns and technical indicators are essential for traders to spot potential trend continuations and make informed decisions. This guide covers how to use patterns like flags, triangles, and candlestick signals alongside indicators like RSI, MACD, and moving averages for better trading accuracy.
Key Takeaways:
- Continuation Patterns: Flags, pennants, and triangles signal pauses in trends before resuming the original direction.
- Technical Indicators: Use momentum (RSI, MACD), volume (OBV), and trend tools (moving averages) to confirm patterns.
- Combining Strategies: Merging patterns with indicators improves accuracy, with studies showing a 12% boost in returns.
- Volume Confirmation: Breakouts with 50%+ volume increase are more reliable.
- Risk Management: Limit trade risks to 1-2% of account equity and use ATR-based stop-loss strategies.
Quick Overview:
| Tool | Purpose | Example Use |
|---|---|---|
| Flags & Pennants | Continuation patterns | Spot breakouts after sharp price moves |
| RSI & MACD | Momentum indicators | Confirm trend strength in patterns |
| Moving Averages | Trend filters | Act as support/resistance during patterns |
| Volume Analysis | Breakout validation | Ensure strong volume during breakout |
Start improving your trading strategies by combining these approaches for better results.
Continuation Patterns: Triangles, Flags and Pennants Trading Course
Common Continuation Patterns
Continuation patterns indicate a pause in a trend before it resumes. They often appear during consolidation phases and can signal upcoming price moves in the direction of the original trend.
Flags and Pennants
Flags and pennants are two of the most dependable continuation patterns. They usually form after sharp price moves and, while structurally different, share similar volume behaviors:
| Pattern Type | Structure | Volume Behavior | Duration |
|---|---|---|---|
| Flag | Parallel trendlines against trend | Volume drops during formation, spikes on breakout | 1-3 weeks |
| Pennant | Converging trendlines | Gradual volume decline, spikes on breakout | 1-3 weeks |
Both patterns rely heavily on volume confirmation, which ties into the indicator strategies discussed in Section 3.
3 Types of Triangle Patterns
Triangles are longer-term consolidation patterns with specific implications for trading:
- Ascending Triangle: Features a flat upper resistance and rising support. Works well with momentum tools like RSI for confirmation.
- Descending Triangle: Has a flat lower support and declining resistance, often signaling growing selling pressure and potential downward continuation.
- Symmetrical Triangle: Shows converging trendlines with similar slopes, representing market balance. Breakouts usually follow the current trend.
The duration of these patterns depends on the market. For example, they may last weeks in stocks but stretch to months in forex.
Candlestick Continuation Signals
Candlestick patterns offer precise entry points within larger continuation setups. A good example is the Rising Three Methods pattern, which appears in uptrends. It includes:
- One strong bullish candle
- Three smaller bearish candles within the range of the first
- A confirmation candle
For these patterns to work effectively, you need:
- Alignment with the overall trend
- Volume confirmation as the pattern completes
- A breakout above or below key support or resistance levels
When combined with features such as LuxAlgo’s real-time detection capabilities (covered later), these candlestick signals become even more actionable.
Using Indicators with Patterns
Combining technical indicators with continuation patterns can strengthen your trading strategy by offering multiple layers of confirmation. Let’s break down how specific indicators can support pattern-based trading decisions.
Momentum Indicator Signals
Momentum indicators reveal the strength behind price movements, helping to confirm continuation patterns. Here’s how to use some of the most popular approaches:
| Indicator | Bullish Signal | Bearish Signal | Pattern Application |
|---|---|---|---|
| RSI | Above 50 and rising | Below 50 and falling | Confirms trend direction in triangles and flags |
| MACD | Crosses above signal line | Crosses below signal line | Validates breakout momentum |
| Stochastic | Rising from oversold | Falling from overbought | Times entry points in pennants |
"Combining momentum indicators with price patterns provides a more robust trading approach, as it considers both price action and underlying momentum." - John Bollinger [1]
Moving Average Filters
Moving averages help identify trends and filter out false breakouts by acting as dynamic support and resistance levels. Here are two effective strategies:
20/50 EMA Strategy
- When the price stays above both EMAs (with the 20 EMA above the 50 EMA), it confirms bullish patterns.
- Breakouts crossing both EMAs signal stronger potential moves.
50/200 SMA Framework
- Patterns above both SMAs in uptrends are more reliable.
- The 50 SMA often serves as a bounce point during flag consolidations.
- Breakouts crossing these key averages tend to have stronger follow-through.
"Moving averages act as a trend filter, helping traders avoid false breakouts and stay on the right side of the market." - Linda Raschke [5]
Volume Analysis for Breakouts
Volume plays a critical role in validating breakout patterns. Here’s how to interpret volume behavior effectively:
Key Volume Patterns
- Volume typically declines during pattern formation (e.g., flags or pennants).
- A 50% or greater increase in volume during a breakout signals strong confirmation.
- On-Balance Volume (OBV) alignment with the trend provides additional validation.
Volume Confirmation Table
| Pattern Stage | Volume Behavior | Action Signal |
|---|---|---|
| Formation | Declining volume | Indicates normal consolidation |
| Breakout | 50%+ volume increase | Confirms breakout strength |
| Follow-through | Above average volume | Suggests trend continuation |
"Volume is essential confirmation. Without confirming volume, price breakouts are suspect and prone to failure." - Tom DeMark [3]
For the best results, consider features within LuxAlgo that combine multiple technical indicators. These can help identify high-probability setups where multiple factors align—a concept we’ll explore further in the next section.
Pattern Detection with PAC
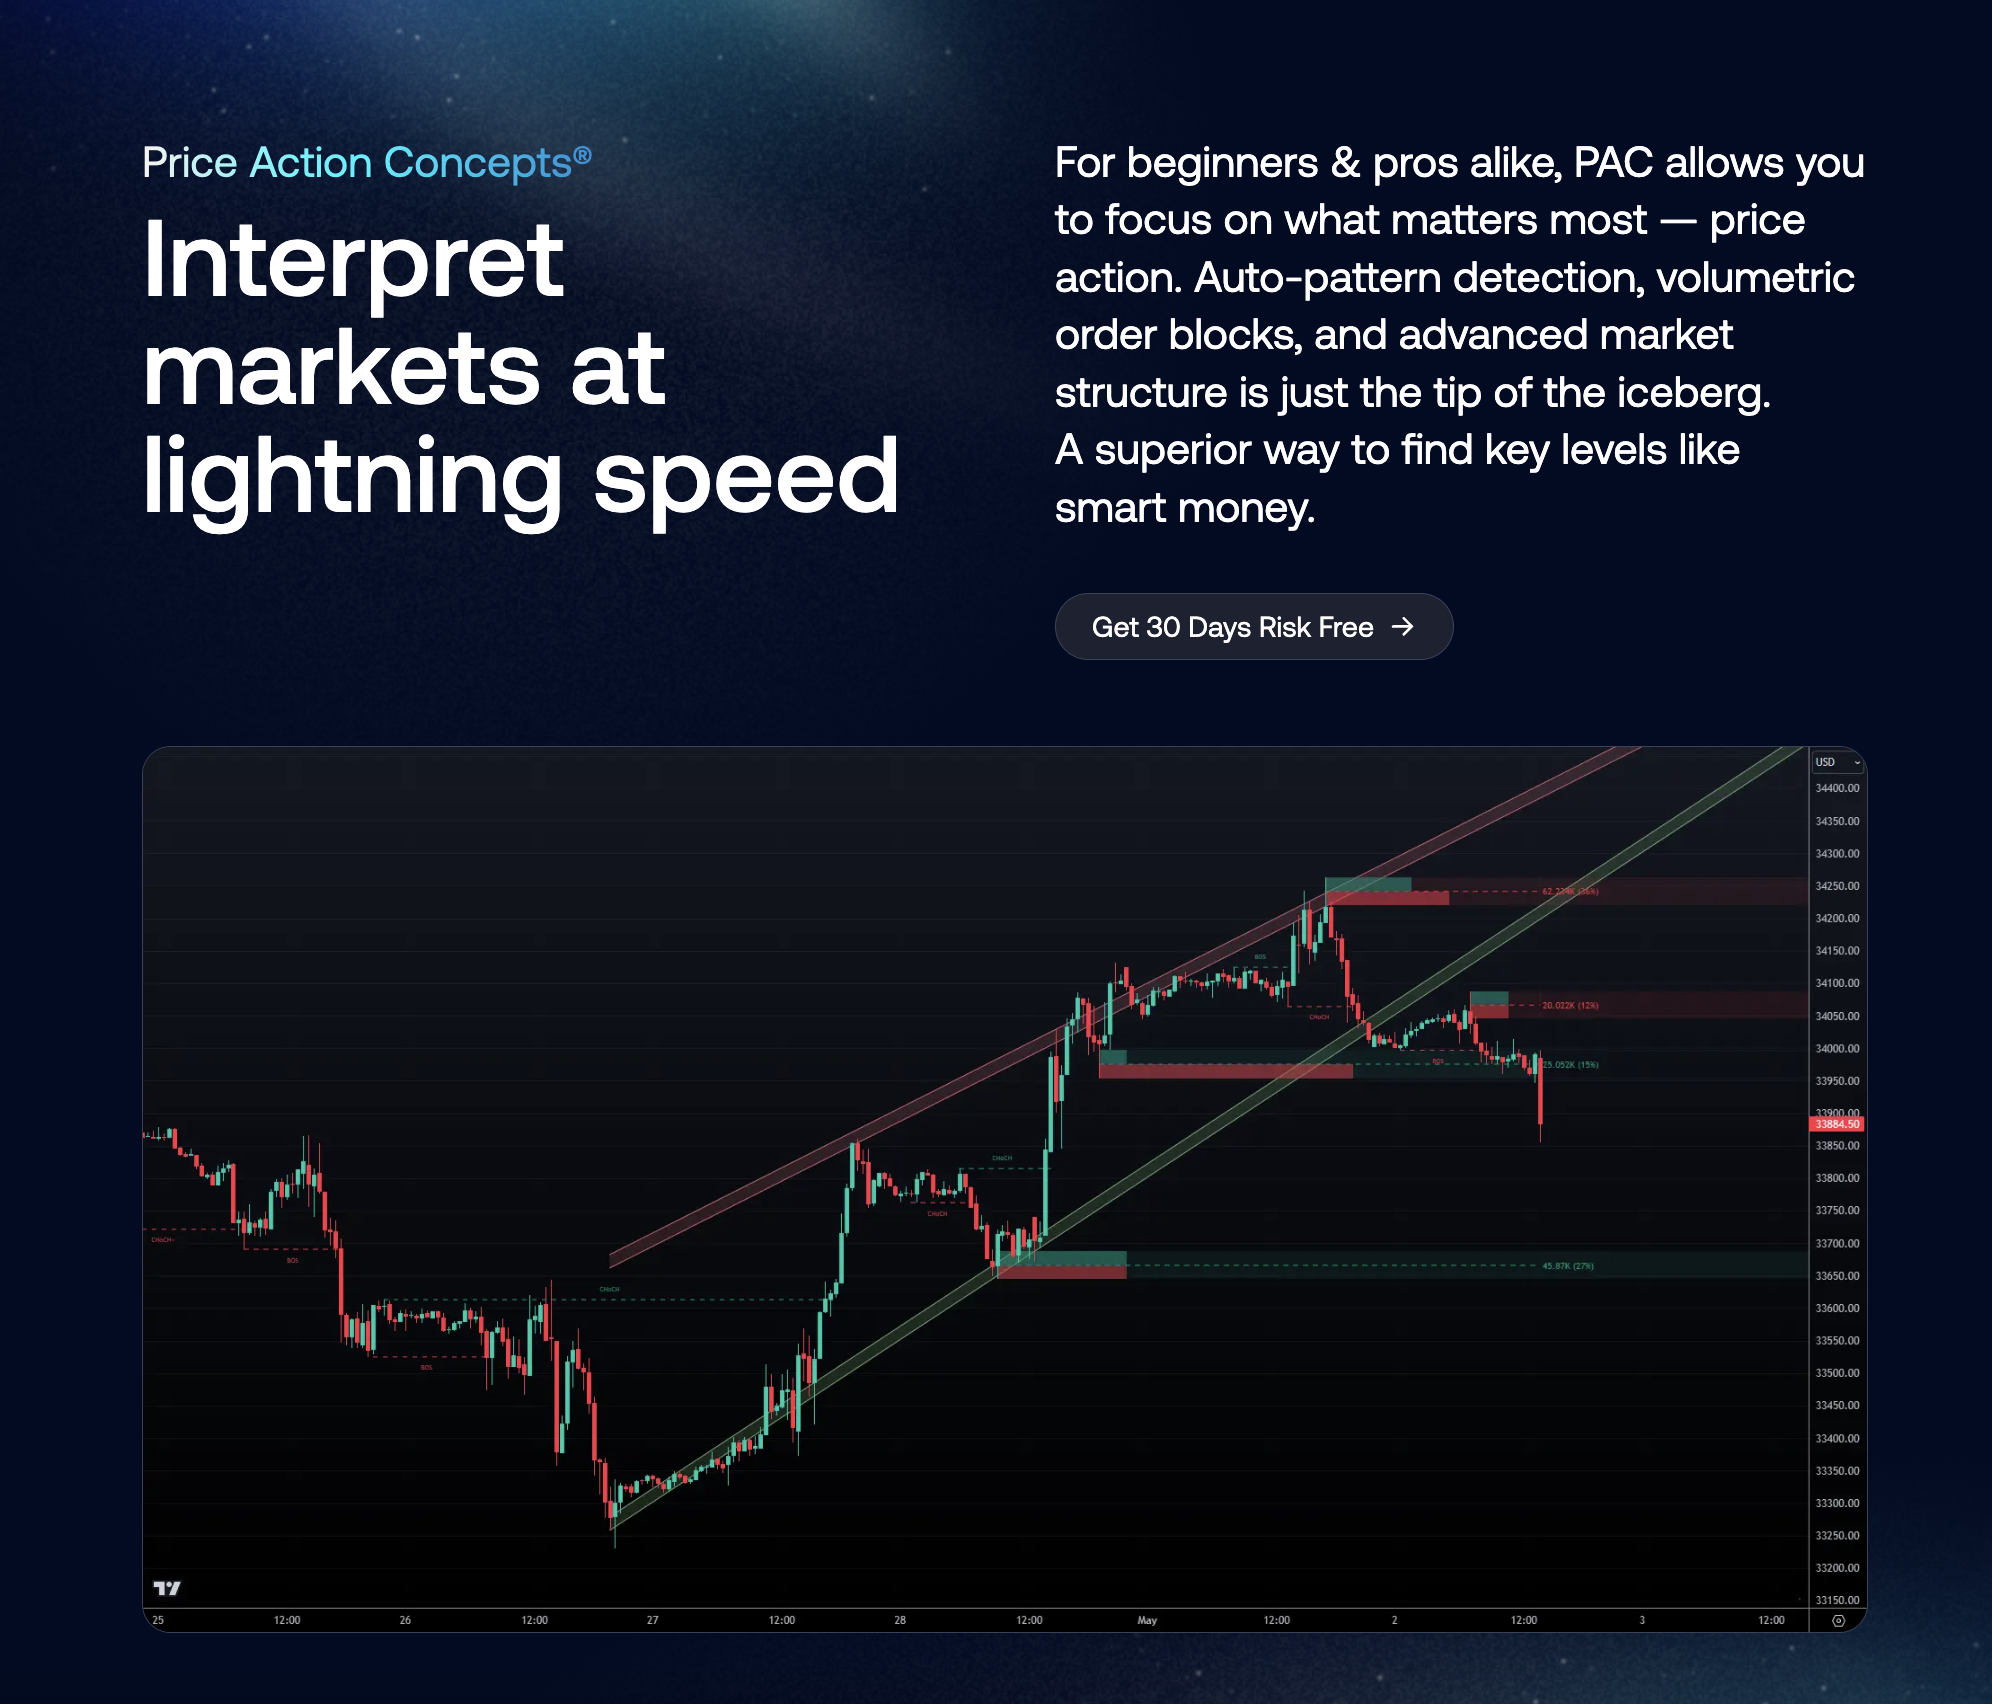
The PAC Toolkit’s pattern detection feature integrates liquidity analysis with price action dynamics. It identifies significant liquidity clusters and assesses the quality of each detected pattern, ensuring that traders are alerted to setups with high potential. This process involves:
- Scanning for liquidity voids and clusters that indicate possible support or resistance areas.
- Filtering out low-quality patterns that do not exhibit strong liquidity signals.
- Providing actionable insights by correlating detected patterns with market context and volatility.
AI Strategy Testing
LuxAlgo’s AI Backtesting Assistant helps traders fine-tune their strategies with ease. Here's how it works:
Backtesting Made Easy
- Analyzes performance across multiple assets and market conditions.
- Automates the optimization of entry and exit parameters.
- Assesses historical success rates of detected patterns.
This ties back to earlier insights on volume-confirmed breakouts and liquidity-based pattern detection, allowing traders to methodically test these concepts.
"LuxAlgo's AI Backtesting Assistant helped increase my pattern trading win rate from 52% to 68% by optimizing entry timing and stop-loss placement." - John D., Professional Forex Trader [6]
The platform’s optimization engine can test thousands of parameter combinations, ensuring strategies adapt to changing market conditions.
In addition to detection and testing, LuxAlgo offers resources to help traders confidently apply these exclusive features.
- Access to a 180,000+ member trading community, available 24/7 [8].
Pattern Trading Risk Management
Using the pattern-indicator strategies we've covered, managing risk effectively is key to making the most of continuation setups while safeguarding your capital.
Position Size Rules
Keep your risk per trade between 1-2% of your account equity. Adjust your position size based on stop-loss levels and market volatility. Here's a simple formula to calculate position size: (Account Risk %) / (Stop Distance × Pip Value).
Key guidelines for managing position size:
- Limit risk to 1-2% of account equity per trade.
- Adjust position size according to pattern stop levels.
- Factor in leverage when calculating positions.
Stop-Loss Methods
Set stop-loss levels based on the structure of the pattern you're trading. For example:
- Place stops 1-2 ATR (Average True Range) beyond flag patterns.
- Use 15-30 pips beyond triangle boundaries.
- Position stops on the opposite edge of rectangles, adding a volatility buffer.
Exclusive features like LuxAlgo's volatility indicators can help automate ATR-based stop-loss settings, making it easier to manage trades.
Taking Profits
When it comes to locking in gains, aim for measured move targets or Fibonacci extensions (like the 161.8% level). Trailing stops can also help you ride extended trends. Consider scaling out of positions by taking partial profits at key levels:
- Measured move targets (pattern height projected from the breakout point).
- 161.8% Fibonacci extension levels.
- Trailing stops for capturing longer trends.
Scaling out allows you to secure profits while keeping part of your position open for potential additional gains [1][4].
Summary
Reviewing Patterns and Indicators
Combining patterns with technical indicators can significantly improve trading outcomes. A study involving 1,000 forex traders revealed that those who used both achieved a 62% win rate, compared to just 48% for traders relying on patterns alone [2].
Tools for Trading
LuxAlgo's PAC streamlines pattern trading by automating detection and providing quality scores. Additionally, the AI Backtesting Assistant helps refine strategies by analyzing historical data and identifying the best indicator pairings.
Key Trading Principles
The insights from our pattern-and-indicator analysis highlight three main areas to focus on:
- Pattern Validation: Ensure patterns are confirmed by price boundaries, volume trends, and alignment with at least two indicators.
- Risk Control:
- Keep an eye on overall market exposure.
- Adjust position sizes based on the quality of the setup.
- Use multiple time frames for a broader perspective.
- Market Context:
- Stick to patterns that align with the dominant trend.
- Steer clear of low-liquidity periods, which often lead to unreliable signals.
- Watch related markets for additional confirmation.
These principles are most effective when paired with the pattern-indicator strategies discussed earlier in this guide.
FAQs
Which indicator shows candlestick patterns?
Indicators don’t directly display candlestick patterns, but they can confirm their validity and help assess their reliability. Some of the most helpful approaches include:
- Momentum indicators like RSI and MACD to check trend strength.
- Volume oscillators to confirm participation during breakouts.
- Volatility tools such as Bollinger Bands to spot potential breakout levels.
LuxAlgo’s Pattern Recognition Master (PRM) enhances the PAC Toolkit by adding candlestick-specific detection. This feature not only identifies patterns but also provides historical performance data, giving traders a clearer picture of pattern reliability [7].
Key confirmation steps to keep in mind:
- Look for volume spikes during breakouts (explained in Section 3.3).
- Ensure the pattern aligns with the overall trend direction.
- Check that momentum indicators don’t show bearish or bullish divergence.
Volume confirmation is essential and ties back to the breakout validation principles from Section 3.3. While these approaches are useful, they should support – not replace – price action analysis. Start with price action, then use indicators to back up your findings.