Explore how trading volume reveals market activity, validates trends, and enhances trading strategies across stocks, forex, and cryptocurrencies.
Trading volume measures the total number of shares, contracts, or units traded within a specific timeframe. It reveals market activity and liquidity, helping traders validate trends, spot reversals, and confirm breakouts. High volume often indicates strong market participation, while low volume signals weaker conviction. Here's what you need to know:
-
Key Insights:
- High volume supports trend strength; low volume may indicate weakening trends.
- Volume spikes often occur during earnings reports, news events, or breakouts.
- Divergence between price and volume can signal potential reversals.
-
Market Differences:
- Stocks: Measured in shares.
- Forex: Measured in lots or tick volume.
- Crypto: Measured in USD or token units.
-
Tools to Analyze Volume:
- Indicators like VWAP, OBV, and Volume Profile provide insights, while advanced features such as the Volume Delta offered by LuxAlgo deliver real‐time insights into buying and selling pressure.
- Complementary screeners and backtesters are available for each toolkit on TradingView.
Trading volume is essential for understanding price movements and improving trading strategies. Dive into the article for actionable tips and tools to leverage volume effectively.
Understanding Volume Analysis in Trading
Reading and Measuring Volume
Volume in Different Markets
Trading volume isn't the same across all markets – it varies depending on the market type and how it’s measured. Knowing these differences is key for accurate analysis.
In the stock market, volume refers to the total number of shares traded. For instance, if 100 shares of Apple (AAPL) stock are traded in a day, the volume is recorded as 100 shares [1]. This gives traders an idea of market activity and liquidity.
In the forex market, volume is measured in lots, where one standard lot equals 100,000 units of the base currency [2]. Retail traders often deal with tick volume, which tracks price changes rather than actual transactions. Due to the decentralized nature of forex, tick volume serves as an estimate of market activity [3].
Cryptocurrency markets, on the other hand, usually report volume in terms of USD or BTC [2]. This standardization makes it easier to compare trading activity across various tokens.
| Market Type | Volume Unit | Daily Volume (2022) |
|---|---|---|
| Stocks | Shares | - |
| Forex | Lots | $6.6 trillion [2] |
| Crypto | USD/BTC | $50-150 billion [2] |
Volume Levels and Their Meaning
The level of trading volume can reveal a lot about market conditions. Periods of high volume often indicate strong market participation and higher liquidity [1][2][3].
For example, during major economic announcements, volume typically follows a predictable pattern: a quiet phase before the news, a sharp spike immediately after (like the 60% surge in forex volume following U.S. Non-Farm Payroll data [4]), and then sustained activity as traders process the information.
Conversely, low volume periods suggest less market participation and weaker conviction behind price movements. Such patterns are common during holiday trading or off-hours [4].
Comparing current volume to historical averages helps traders understand how volume interacts with price changes – a topic we’ll explore next.
Volume and Price Movement
Using Volume to Verify Trends
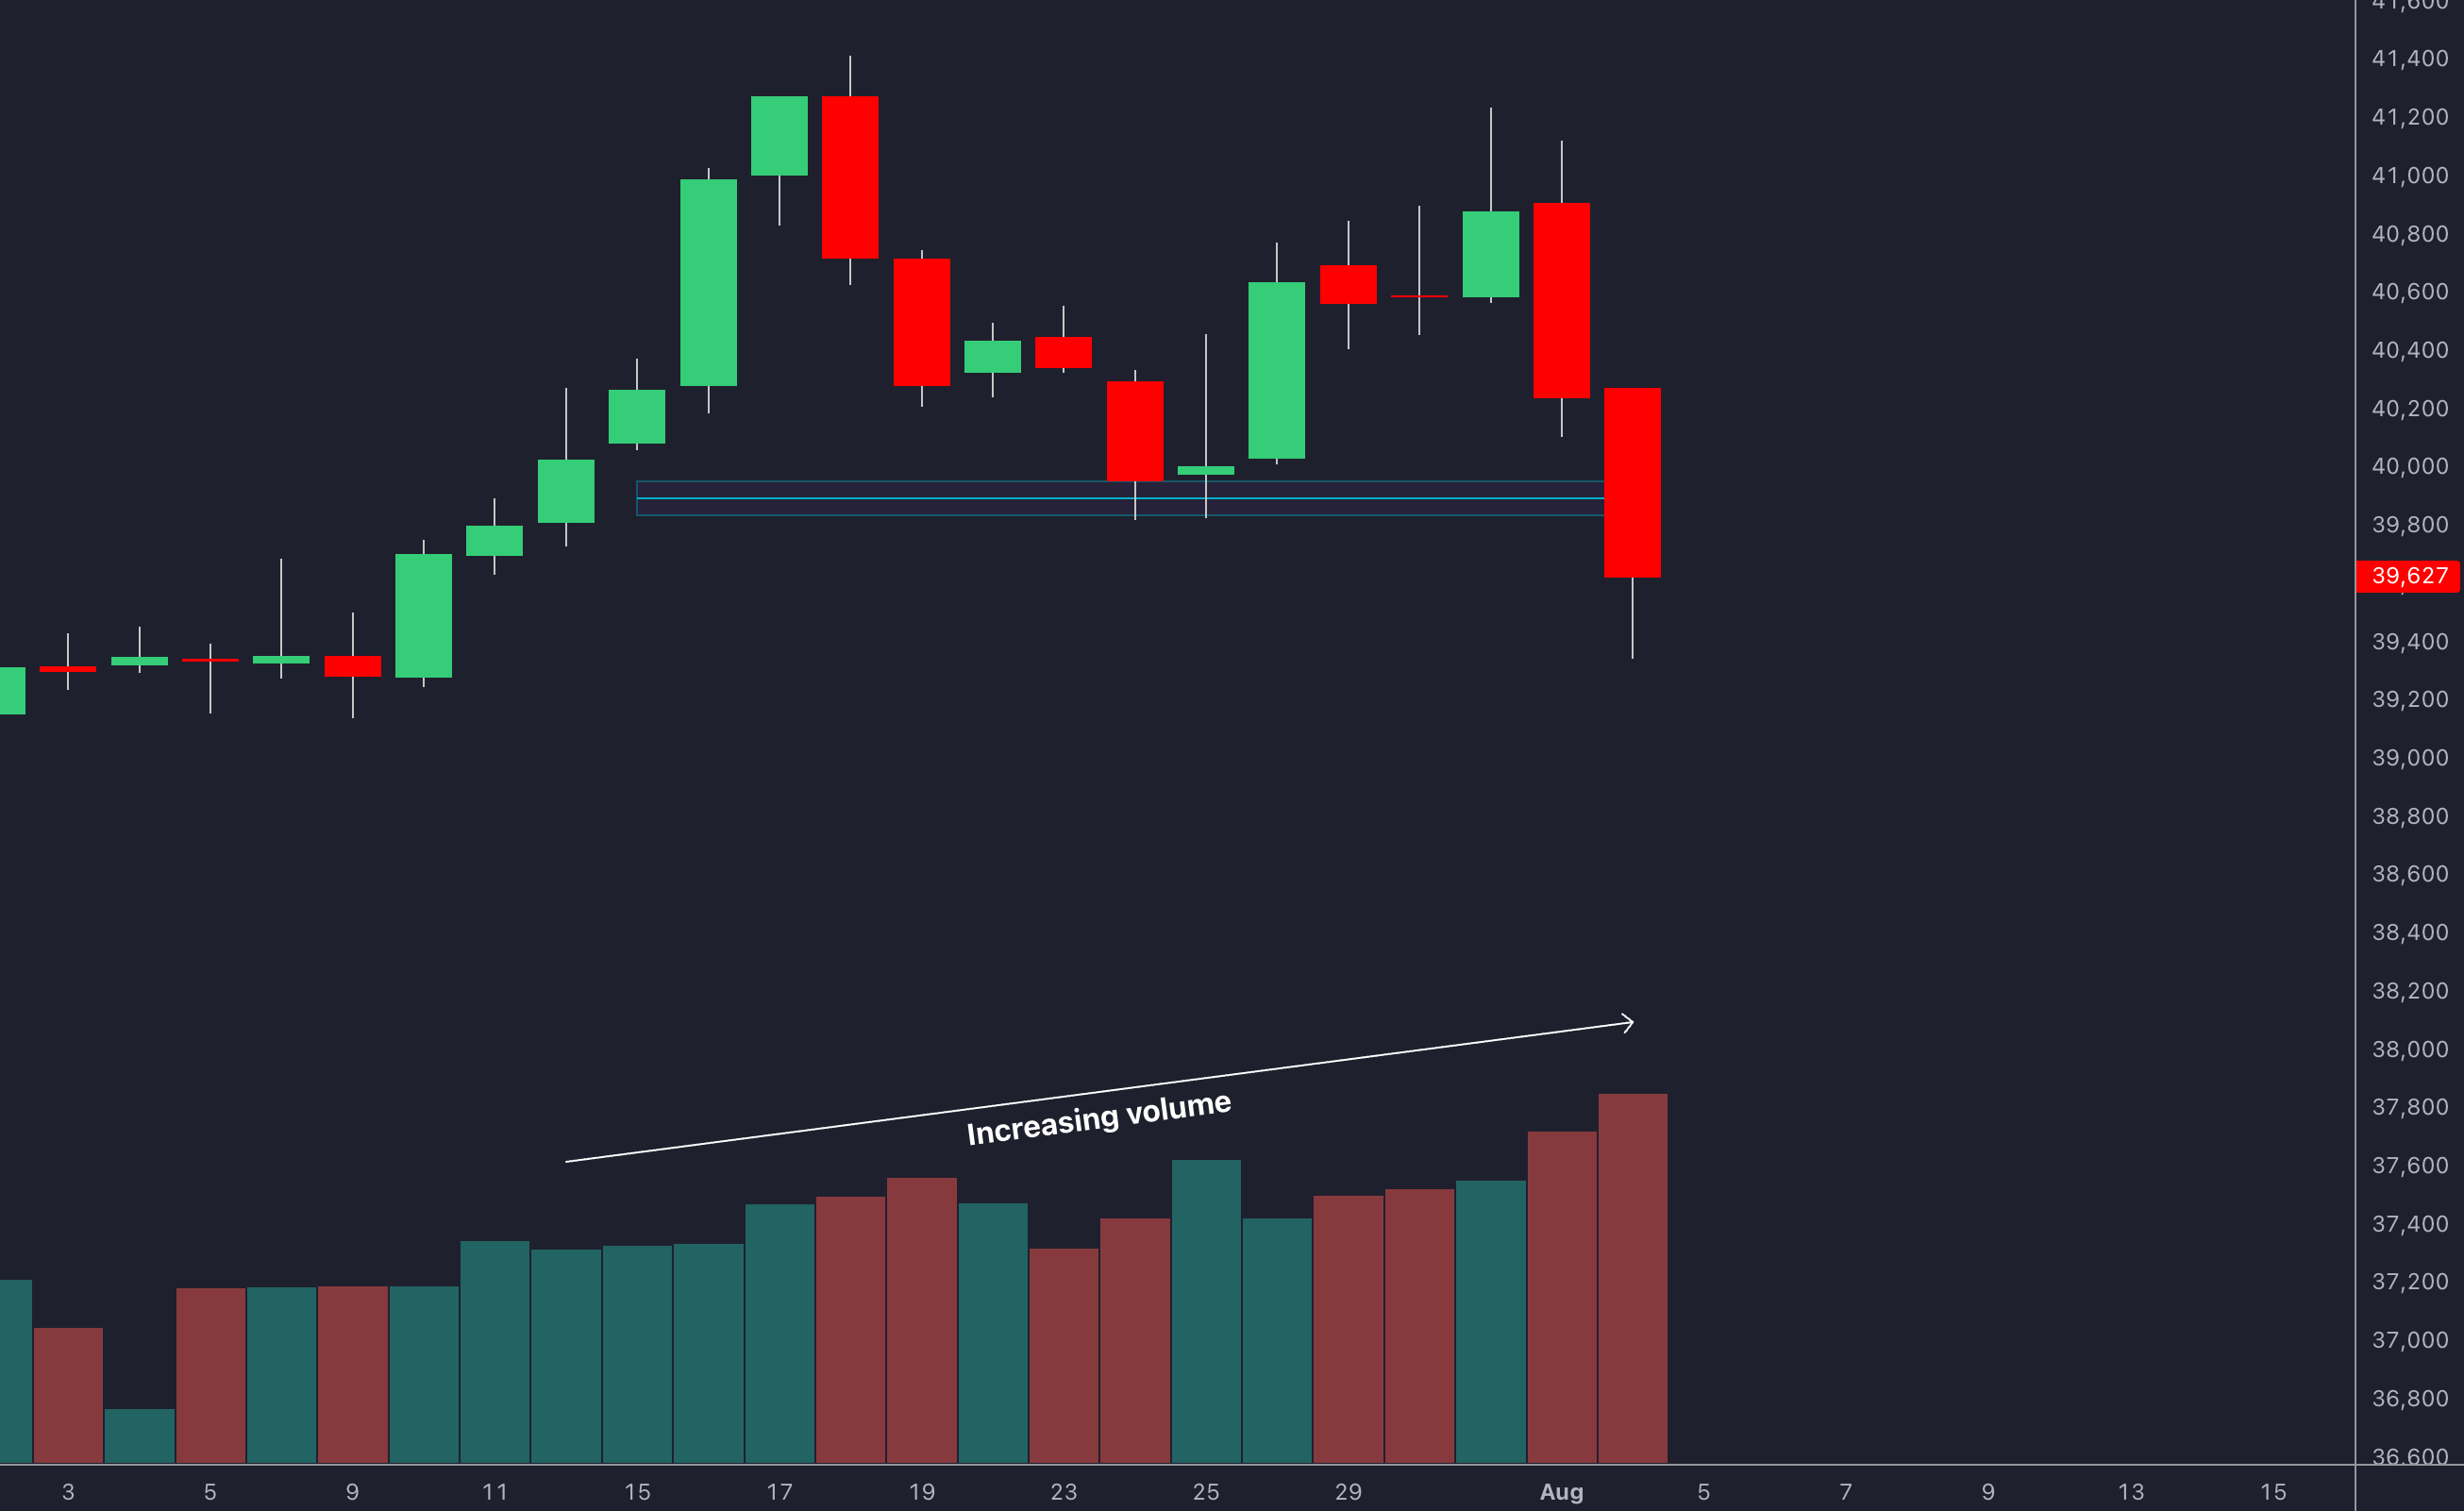
Volume plays a key role in confirming whether a trend is genuine. When volume aligns with price direction, it strengthens the trend's credibility. For a trend to hold, volume should increase in the direction of the move and decrease during corrections.
For example, rallies in the energy sector often experience 20-30% higher volume on advancing days compared to pullbacks, reinforcing the trend's strength [7]. This behavior confirms price movements and suggests the trend is likely to continue.
| Price Movement | Healthy Volume Pattern | What It Indicates |
|---|---|---|
| Uptrend | Higher volume on up days | Strong buying activity |
| Uptrend pullback | Lower volume on down days | Weak selling activity |
| Downtrend | Higher volume on down days | Strong selling activity |
| Downtrend rally | Lower volume on up days | Weak buying activity |
Volume and Price Divergence
When price and volume move in opposite directions, it often signals a potential trend reversal. This divergence serves as an early warning that the current trend may be losing momentum, highlighting possible shifts in market dynamics.
In index futures markets, high trading activity often clusters around critical price levels [1][4]. While divergence suggests internal market weakness, external factors – such as major news events – can accelerate these changes.
News-Related Volume Changes
Big news events tend to cause sharp spikes in trading volume as market participants react to new developments. These spikes often occur within minutes of the news breaking. For instance, merger announcements can lead to volume surges exceeding 500% of the average daily levels [10].
"When the Federal Reserve announces interest rate decisions, forex traders often see significant volume increases in USD pairs and can use this to identify strong trending moves" [11].
Traders can capitalize on these volume spikes by combining them with breakout levels to confirm sustained moves. To leverage news-driven volume changes effectively:
- Monitor volume levels before the news for comparison.
- Use volume spikes to validate breakouts.
- Adjust position sizes to account for increased volatility.
High-volume reactions often indicate that the price movement will continue [7][11].
Volume Analysis Tools
Common Volume Indicators
Volume analysis relies on several key technical indicators to provide traders with actionable insights:
The On-Balance Volume (OBV), introduced by Joseph Granville in the 1960s[6], keeps a running total of volume by adding it on up days and subtracting it on down days. This approach helps traders spot potential trend reversals before they become apparent in price movements.
Traders often combine various indicators for a deeper understanding of volume dynamics:
| Indicator | Purpose | Insight Provided |
|---|---|---|
| Volume Weighted Average Price (VWAP) | Averages price weighted by volume | Identifies dominant trading prices [7] |
| Chaikin Money Flow (CMF) | Tracks buying and selling pressure over time | Reveals accumulation and distribution patterns [2] |
| Money Flow Index (MFI) | Merges volume with RSI calculations | Highlights overbought or oversold conditions with volume confirmation [8] |
The Volume RSI shifts the focus from price momentum to volume momentum [9], helping traders detect periods of unusually high or low volume compared to recent activity.
Another essential indicator is the Volume Profile, which maps trading volume at specific price levels. The Point of Control (POC) pinpoints the price level with the highest traded volume, reinforcing its role as a key support or resistance zone [12].
LuxAlgo Oscillator Matrix
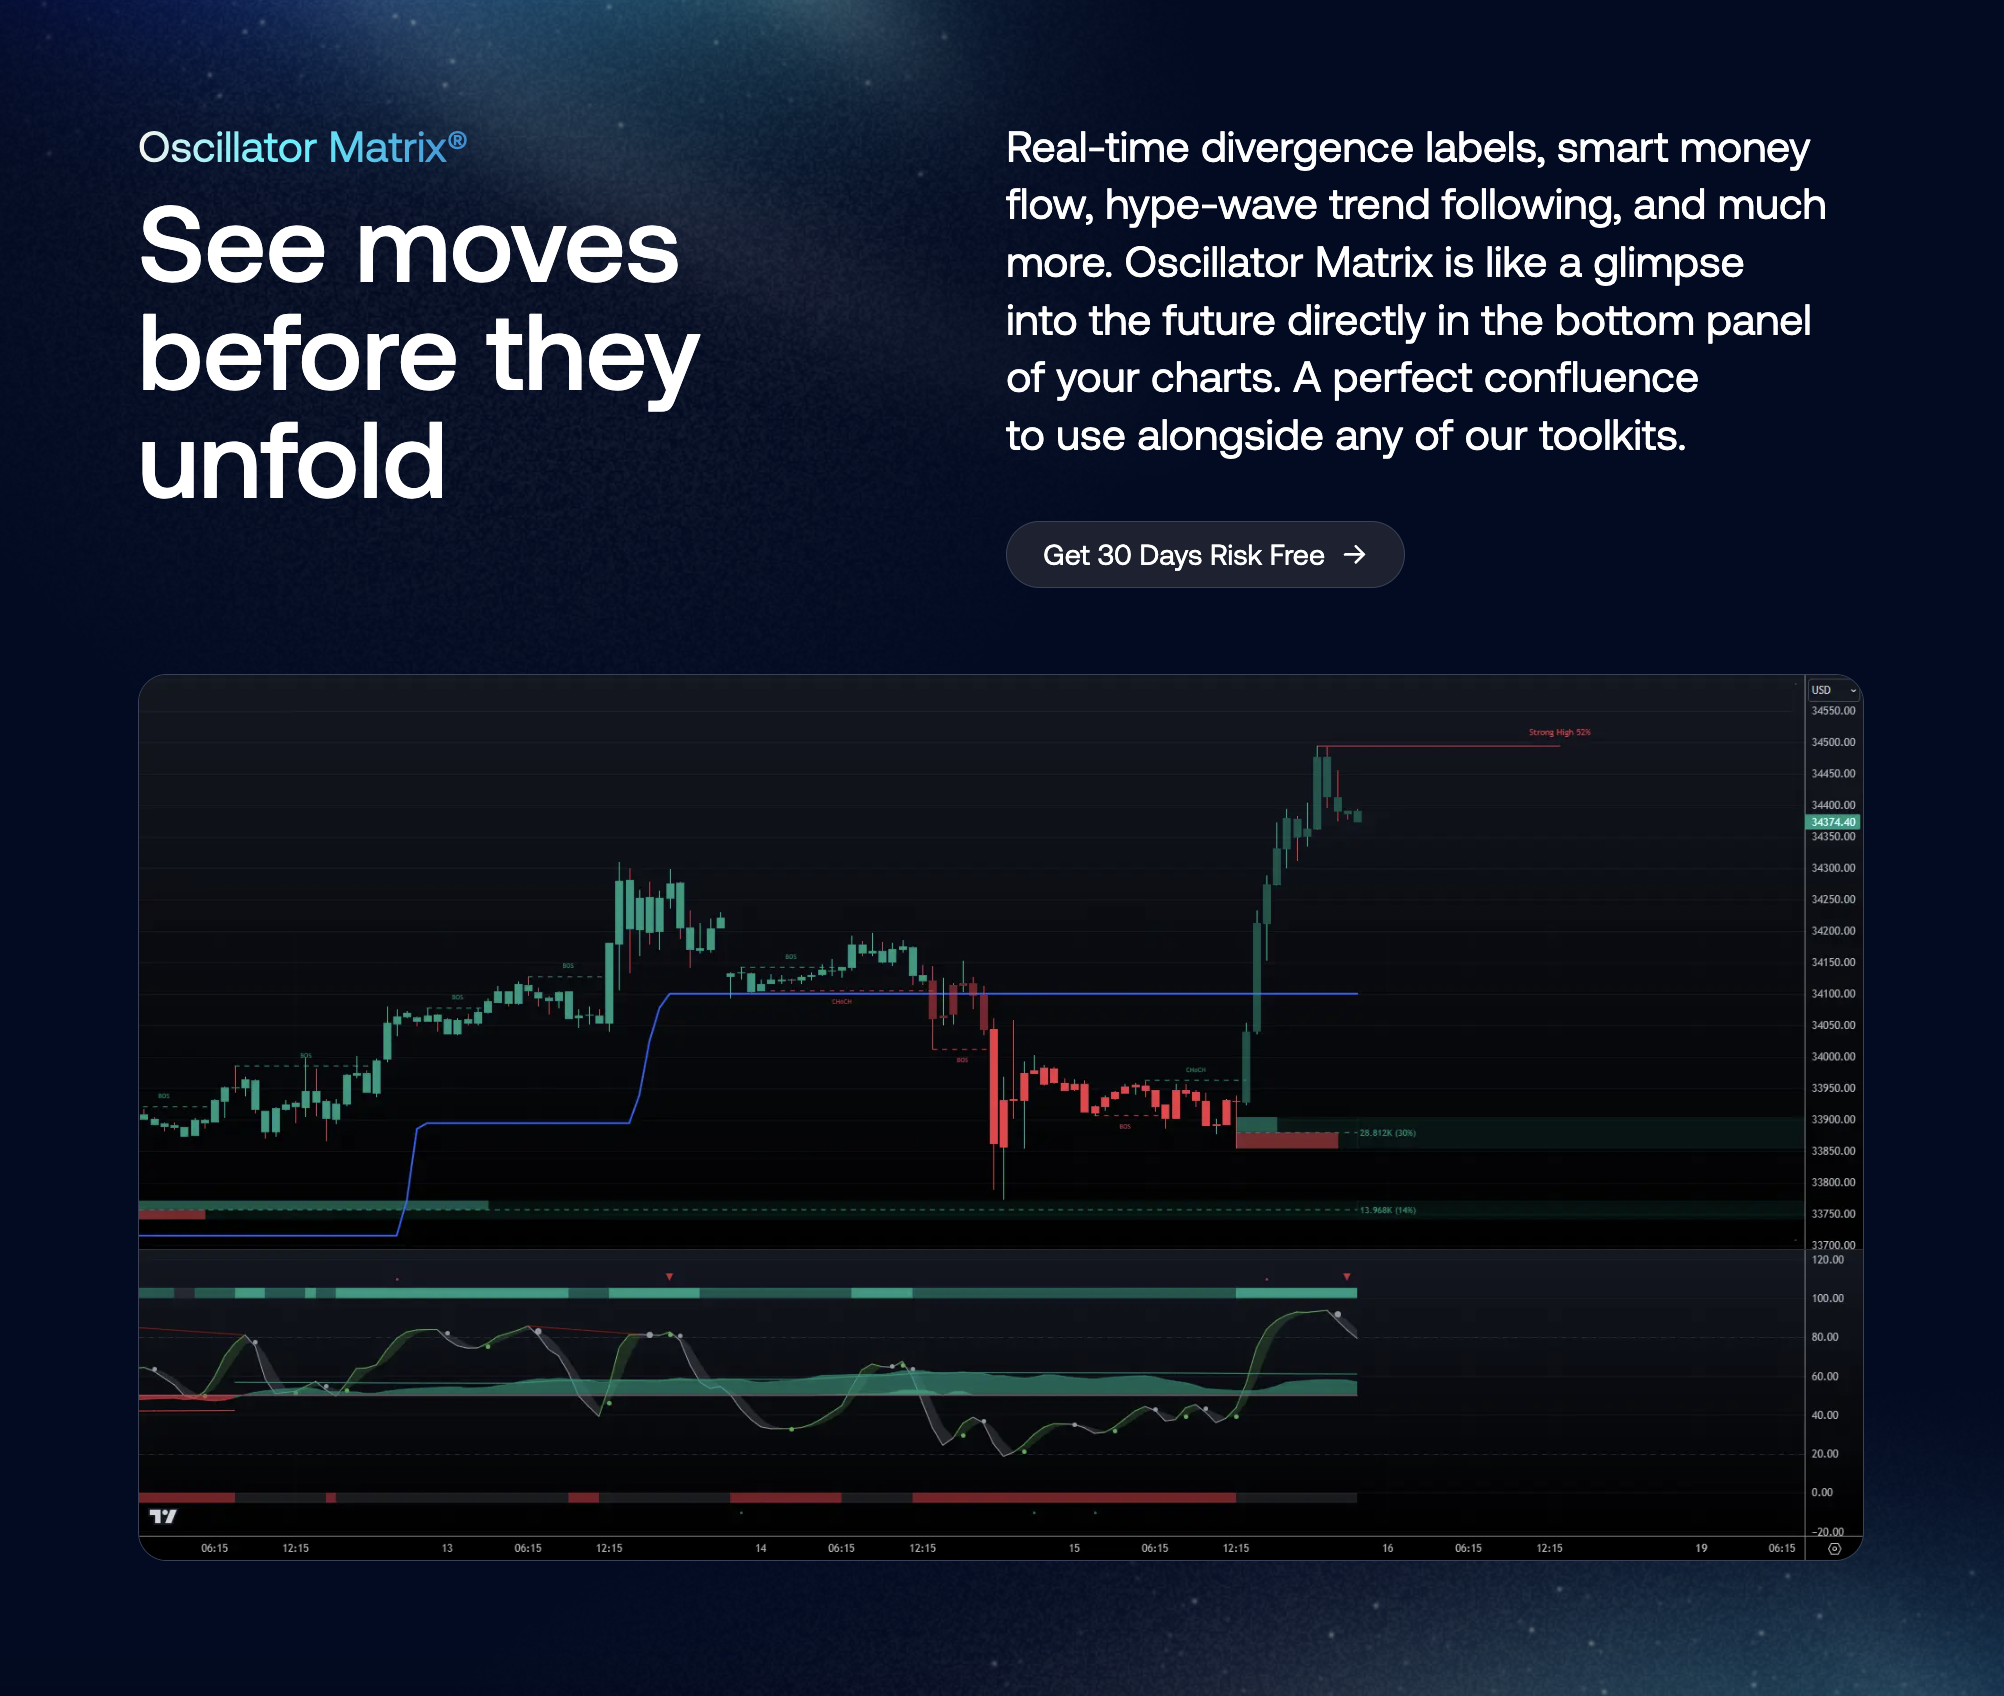
LuxAlgo’s Oscillator Matrix offers an integrated view of multiple oscillators, enabling traders to gauge market momentum and detect overbought or oversold conditions on TradingView. With dynamic visualization and advanced signal detection, the Oscillator Matrix enhances trend validation and helps identify potential reversals. For more details, visit LuxAlgo.com.
Volume Trading Methods
Volume in Breakout Trading
Volume plays a key role in confirming price breakouts. When a breakout is accompanied by high trading volume, it’s more likely to succeed. In fact, breakouts confirmed by strong volume have a 62% higher success rate compared to those with low volume [6].
A great example is Tesla's 2022 breakout above the $780 resistance level. The move was backed by a 127% surge in volume and resulted in a 15% price gain.
Here are some important points to keep in mind when trading breakouts:
- Look for volume spikes that are 50% or more above the average [1].
- Avoid breakouts with less than 150% of the average volume [2].
- Pay attention to whether the increased volume holds up after the breakout.
Spotting False Signals
Volume isn’t just useful for confirming breakouts – it’s also helpful for identifying false signals. Certain volume patterns can reveal when a price move is likely deceptive:
- When the price breaks an important level, but the volume stays below average [7].
- Sudden volume spikes followed by immediate price reversals.
- A mismatch between price peaks and volume trends, known as divergence [3].
Volume in AI Trading
AI trading systems take volume analysis to the next level. They use historical data to identify patterns and make predictions, turning volume‐price relationships into actionable insights. These systems leverage volume data to:
- Recognize complex patterns in how price and volume interact.
- Build predictive models based on historical volume trends.
- Assess liquidity to manage risk more effectively.
For instance, LuxAlgo's AI Backtesting Assistant incorporates volume analysis into strategy development, enabling better pattern recognition and risk management, with volume‐aware approaches delivering stronger breakout results [6].
Conclusion: Volume Analysis Summary
Key Takeaways
Trading volume plays a key role in confirming price movements. It helps traders validate trends, spot potential reversals, and confirm breakouts. Whether you're trading stocks or cryptocurrencies, analyzing volume provides insights into market behavior and the strength behind trends.
When paired with price action – as seen in breakout scenarios or divergence patterns – volume analysis offers a clearer picture of market sentiment. For example, Tesla's surge in 2022 showcased how volume confirmation can help distinguish genuine moves from misleading signals.
Starting with Volume Analysis
To dive into volume analysis, start with basic indicators such as VWAP (Volume Weighted Average Price) and OBV (On-Balance Volume). Once comfortable, explore advanced features like LuxAlgo's Oscillator Matrix which offers capabilities to identify:
- Market momentum through integrated oscillator signals
- Overbought or oversold conditions with dynamic visualization
- Potential reversals and trend confirmations on TradingView
To refine your approach:
- Compare current volume against historical trends.
- Examine multiple timeframes for a broader perspective.
- Account for unique volume behaviors specific to your market.
FAQs
What does trade volume tell you?
Trade volume measures how actively traders are buying and selling a specific asset. It highlights the level of market activity and can indicate the strength of a trend. For example, increasing volume often supports a trend's continuation, while sudden spikes might signal potential reversals [1][4].
For more on interpreting these signals, refer to the Volume and Price Movement section above.
How to analyze price and volume?
Pairing volume data with price movements can reveal trading opportunities and help assess market behavior.
Key techniques to consider:
- Look for volume surges during breakouts (aim for at least 50% above the 20-day average).
- Identify divergence patterns as discussed earlier.
- Utilize volume-weighted indicators for a deeper understanding of trends.
LuxAlgo's advanced features, highlighted in the analysis tools section, simplify this process by offering in-depth volume analysis capabilities [5][13].