Introduction
While no tool can guarantee perfect predictions, Fibonacci levels come close by highlighting key areas where reversals are most likely to occur. By tapping into the natural rhythm of price movement, Fibonacci retracements help traders identify these potential turning points. We'll explore how Fibonacci levels work, how to apply them to your charts, and how they can be a game-changer in your trading strategy.
The Logic Behind Fibonacci Levels
Fibonacci levels are rooted in the Fibonacci sequence, a mathematical pattern found in nature, art, and even human behavior.
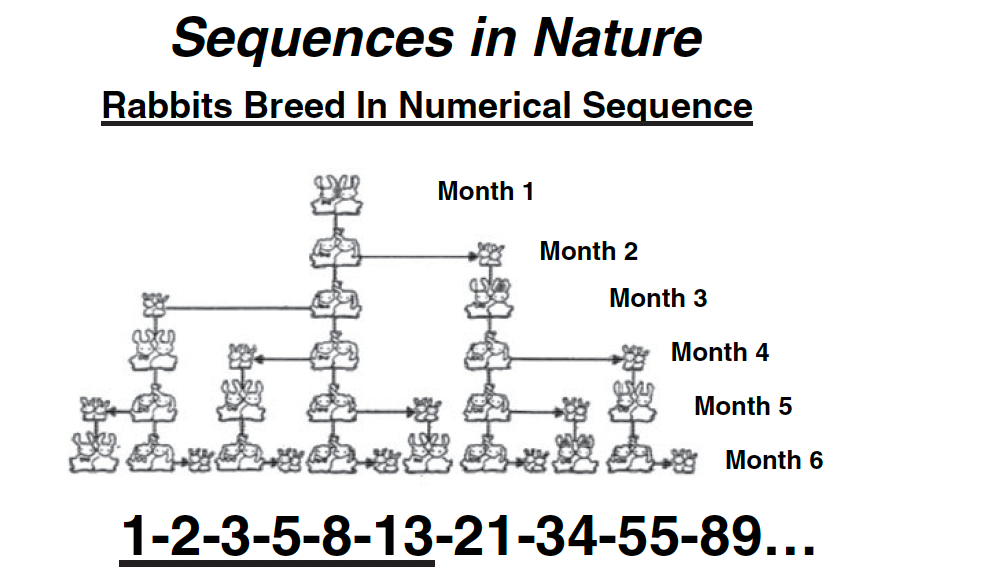
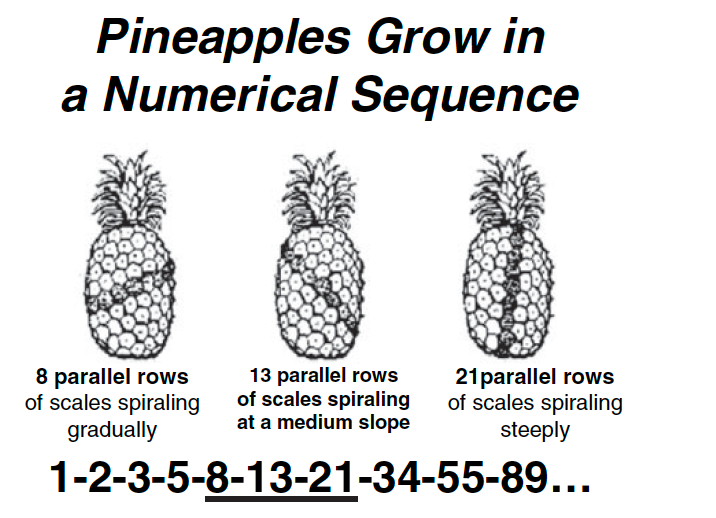

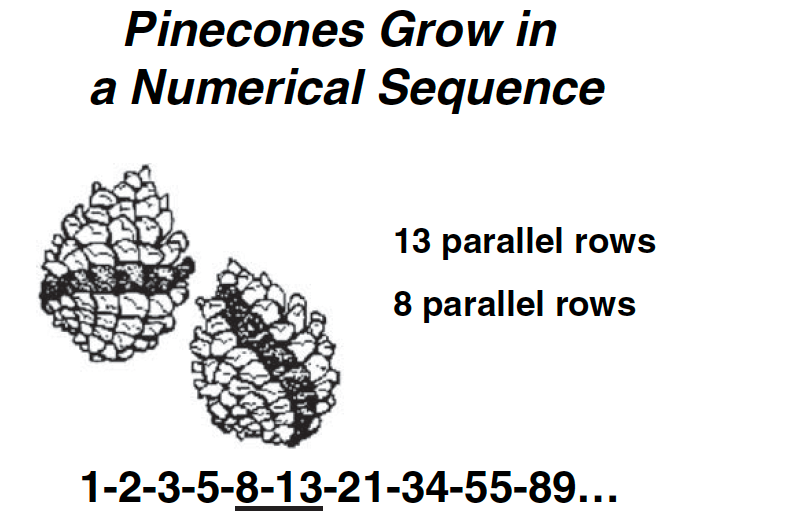
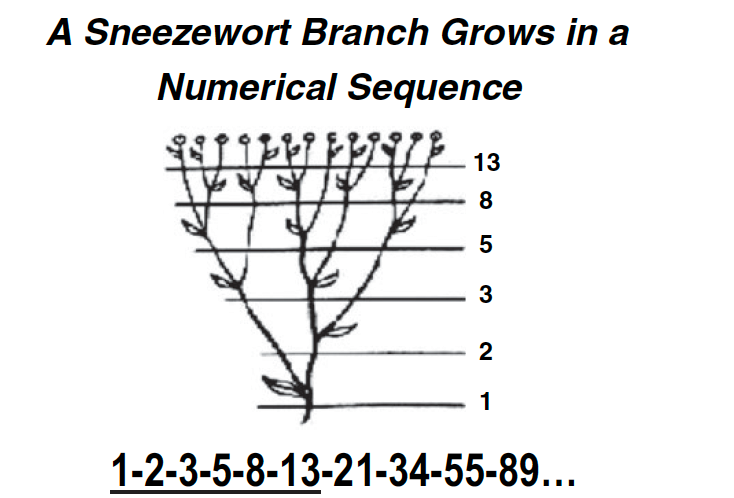
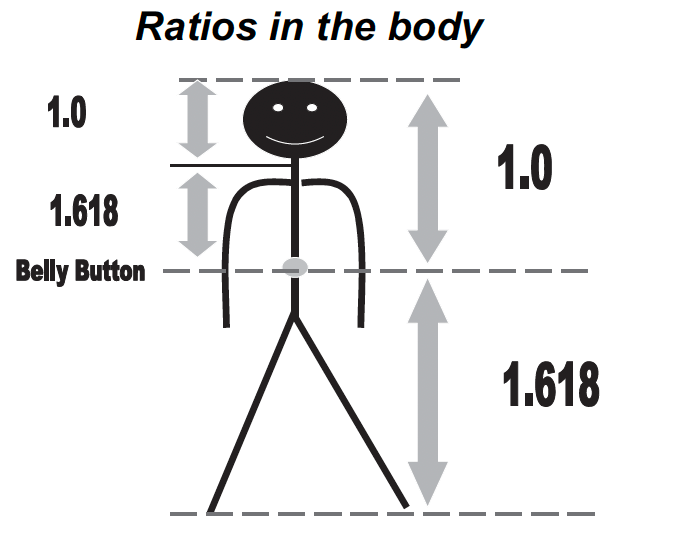
In trading, these levels are used to measure retracement zones during trending markets. The most significant levels — 23.6%, 38.2%, 50%, 61.8%, and 78.6% — represent potential support or resistance points where the price might pause or reverse.
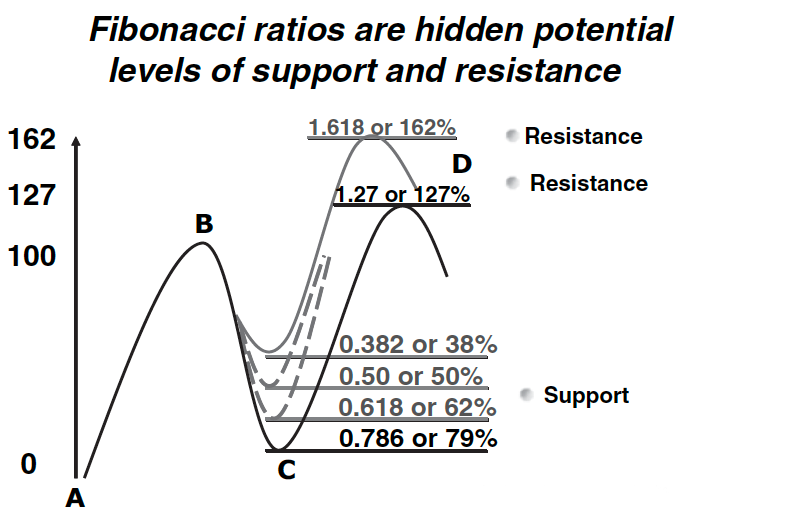
Why do these levels matter? It's largely due to trader psychology. When prices pull back during an uptrend, many traders view these retracement levels as "buy-the-dip" opportunities. The same logic applies in downtrends, where traders might look to short at key Fibonacci levels. The 61.8% level, in particular, is often regarded as the "golden ratio," a point where reversals frequently occur.
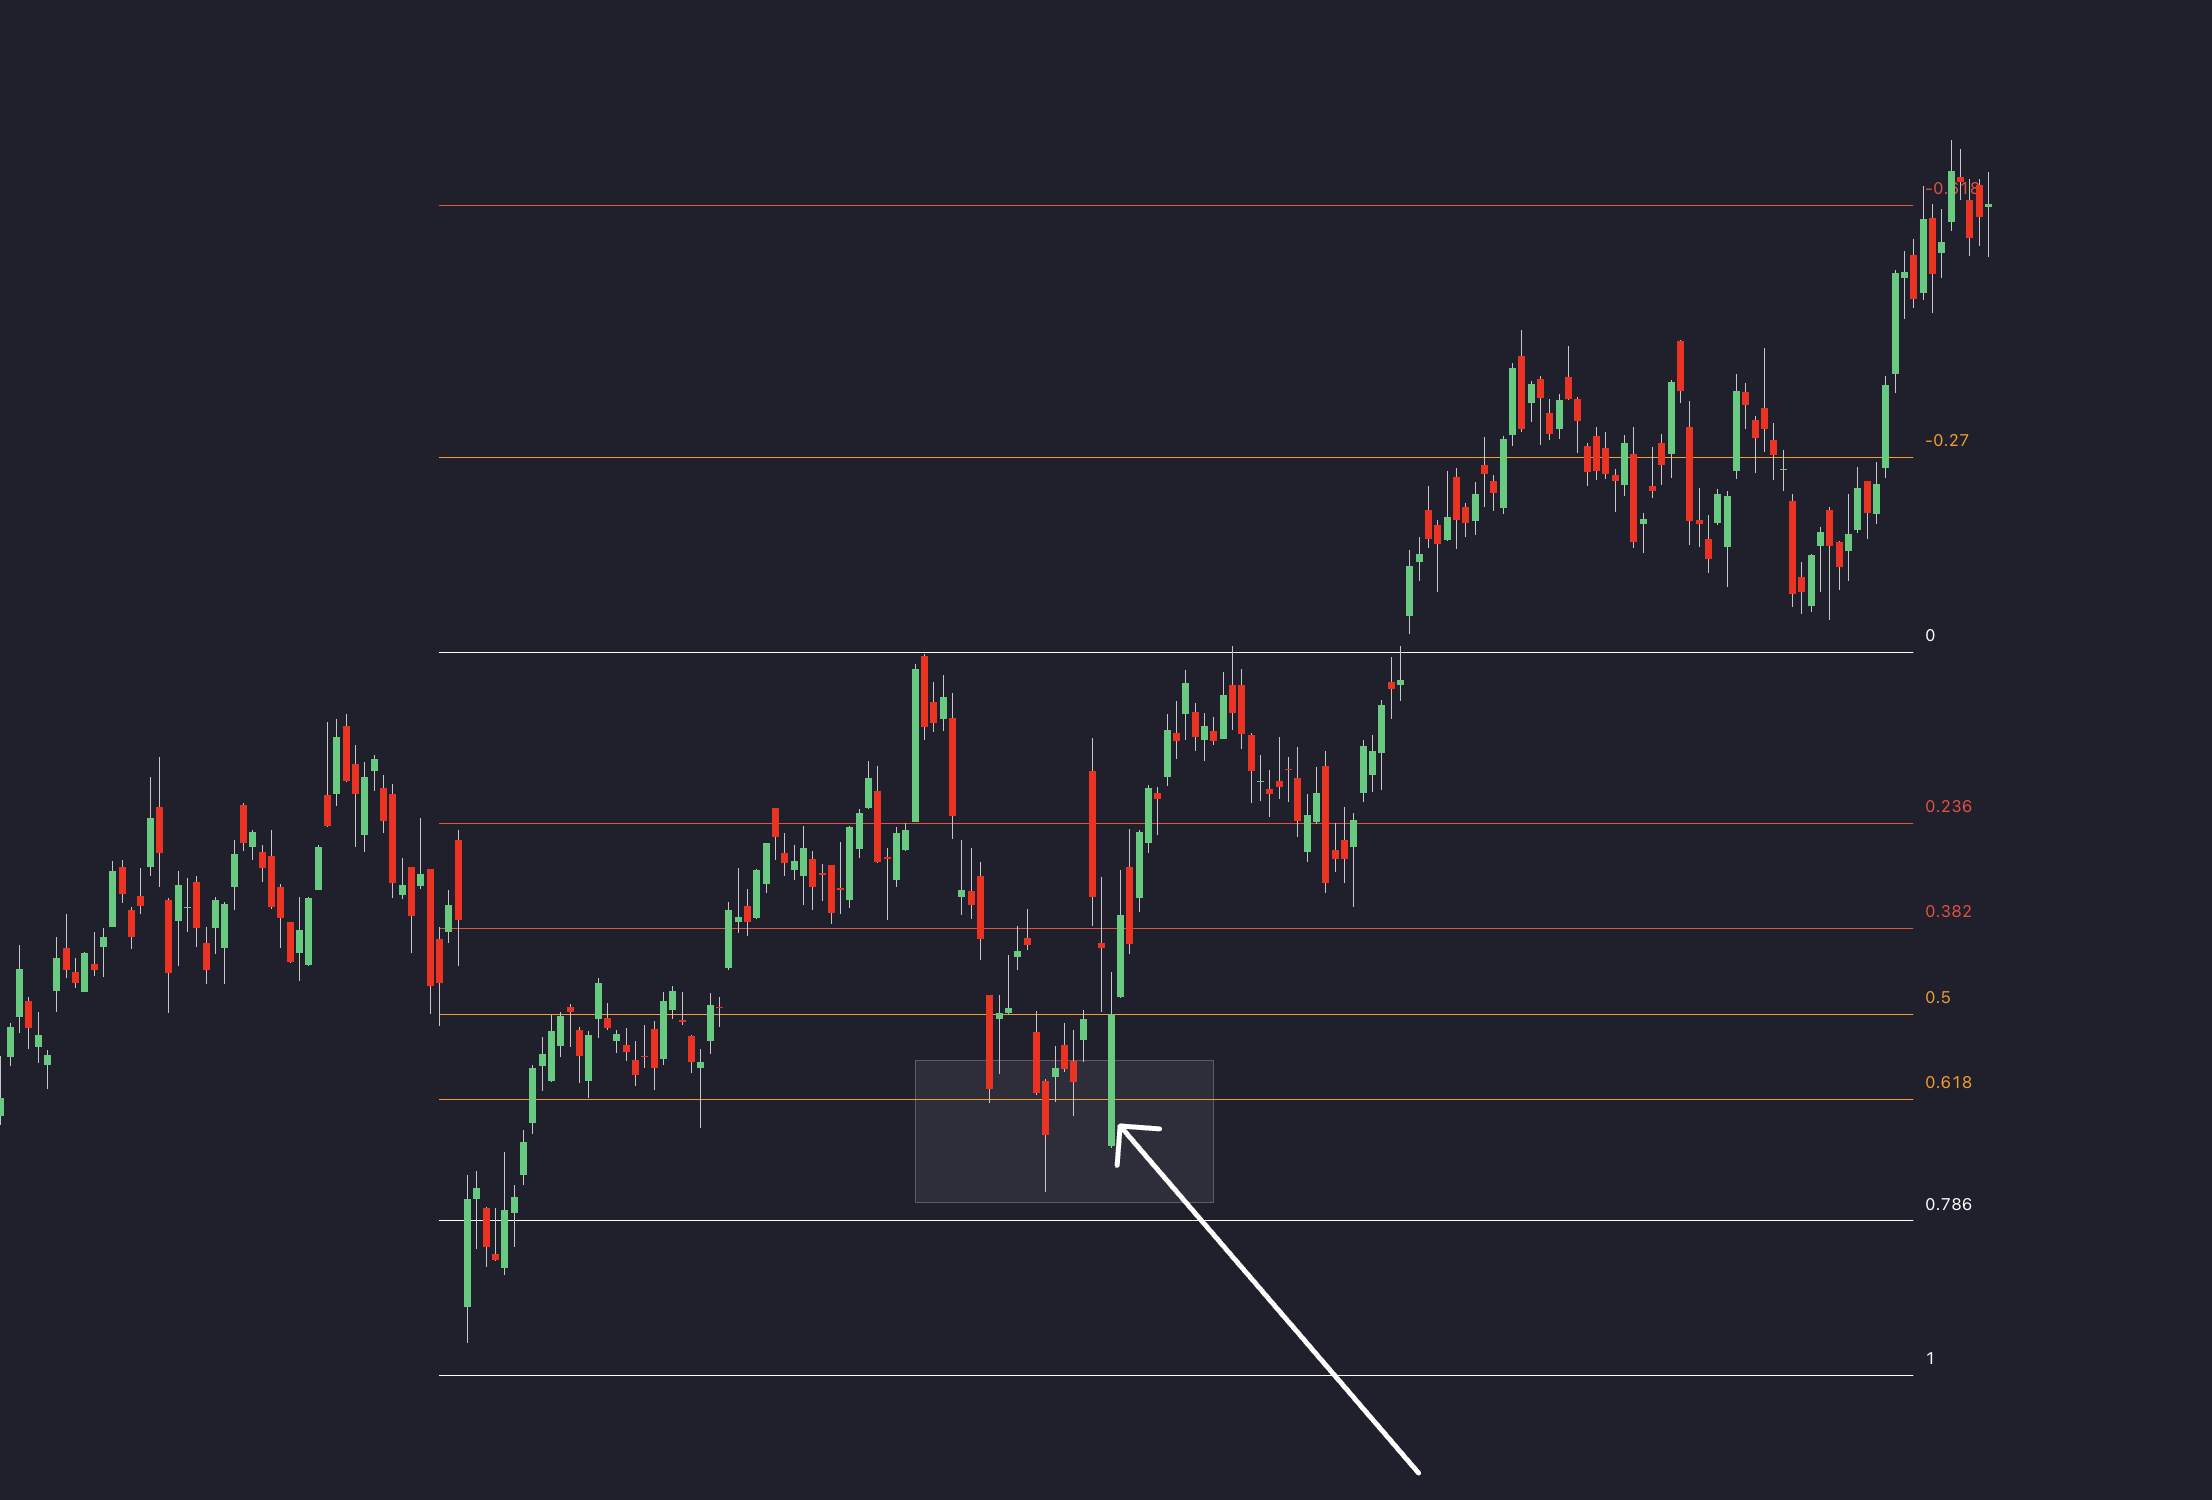
How to Identify Reversal Points Using Fibonacci
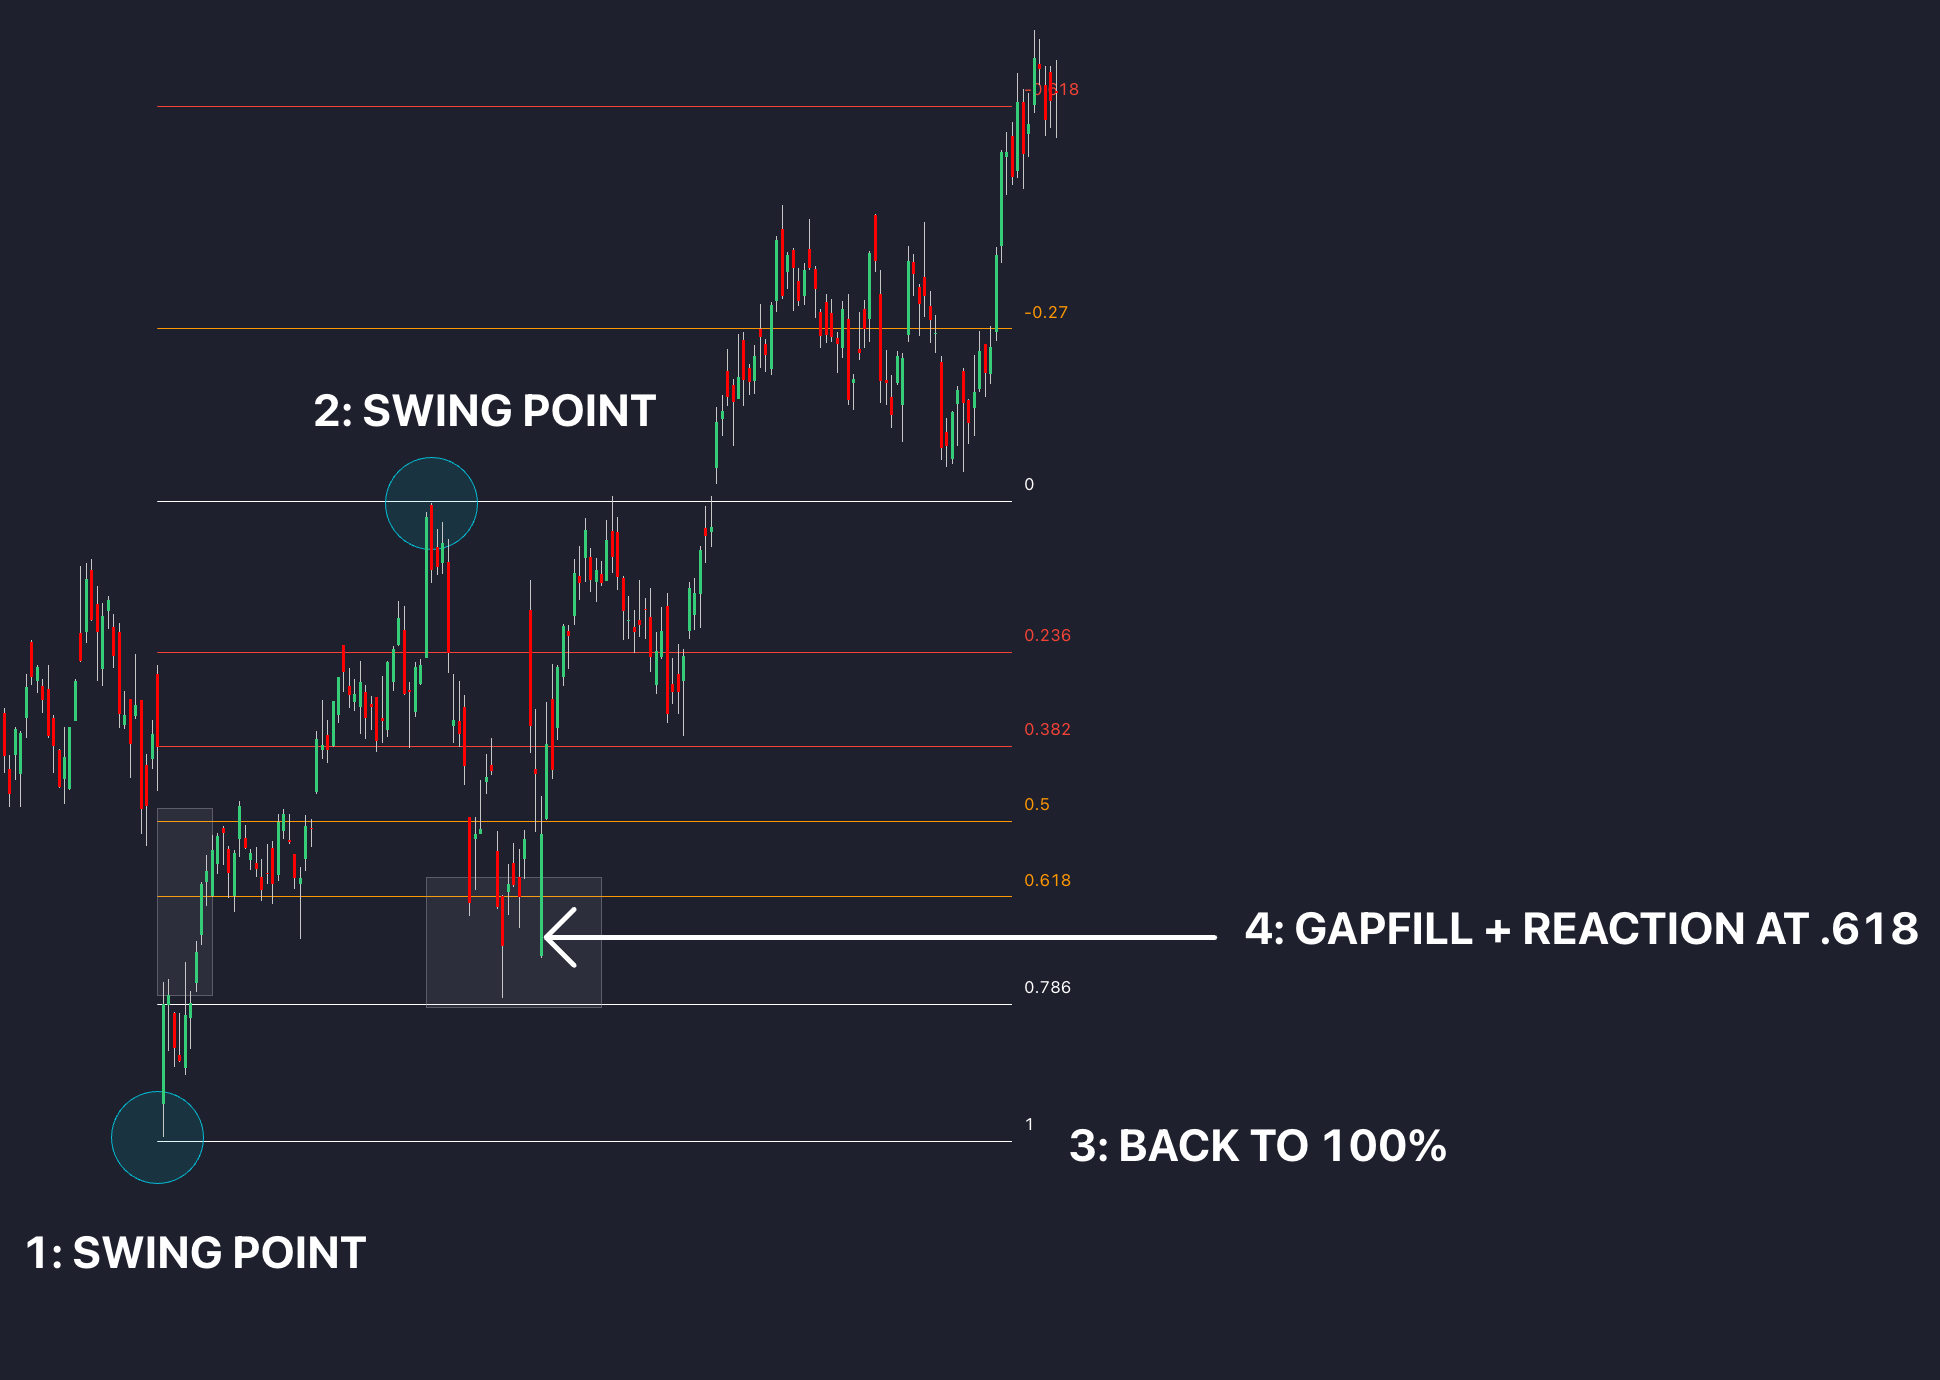
Identifying reversal points with Fibonacci is a step-by-step process that requires precision and patience. Here’s how you can do it:
- Identify Swing Highs and Lows: First, locate the most recent significant swing high and swing low on the chart. In an uptrend, you’ll measure from the low to the high. In a downtrend, measure from the high to the low.
- Draw the Fibonacci Retracement Tool: Use a charting tool to draw the retracement levels between the selected swing points. This will project the key Fibonacci levels (23.6%, 38.2%, 50%, 61.8%, 78.6%) on the chart.
- Look for Confluence Zones: Confluence occurs when a Fibonacci level overlaps with another key level, such as support/resistance, trendlines, or moving averages. The more elements align with a specific Fibonacci level, the stronger the reversal potential.
- Watch for Price Action Confirmation: Once the price approaches a key Fibonacci level, look for reversal patterns, such as pin bars, engulfing candles, or strong rejections from the level. Price action confirmation increases the likelihood of a successful reversal.
Targets Using Fibonacci Levels
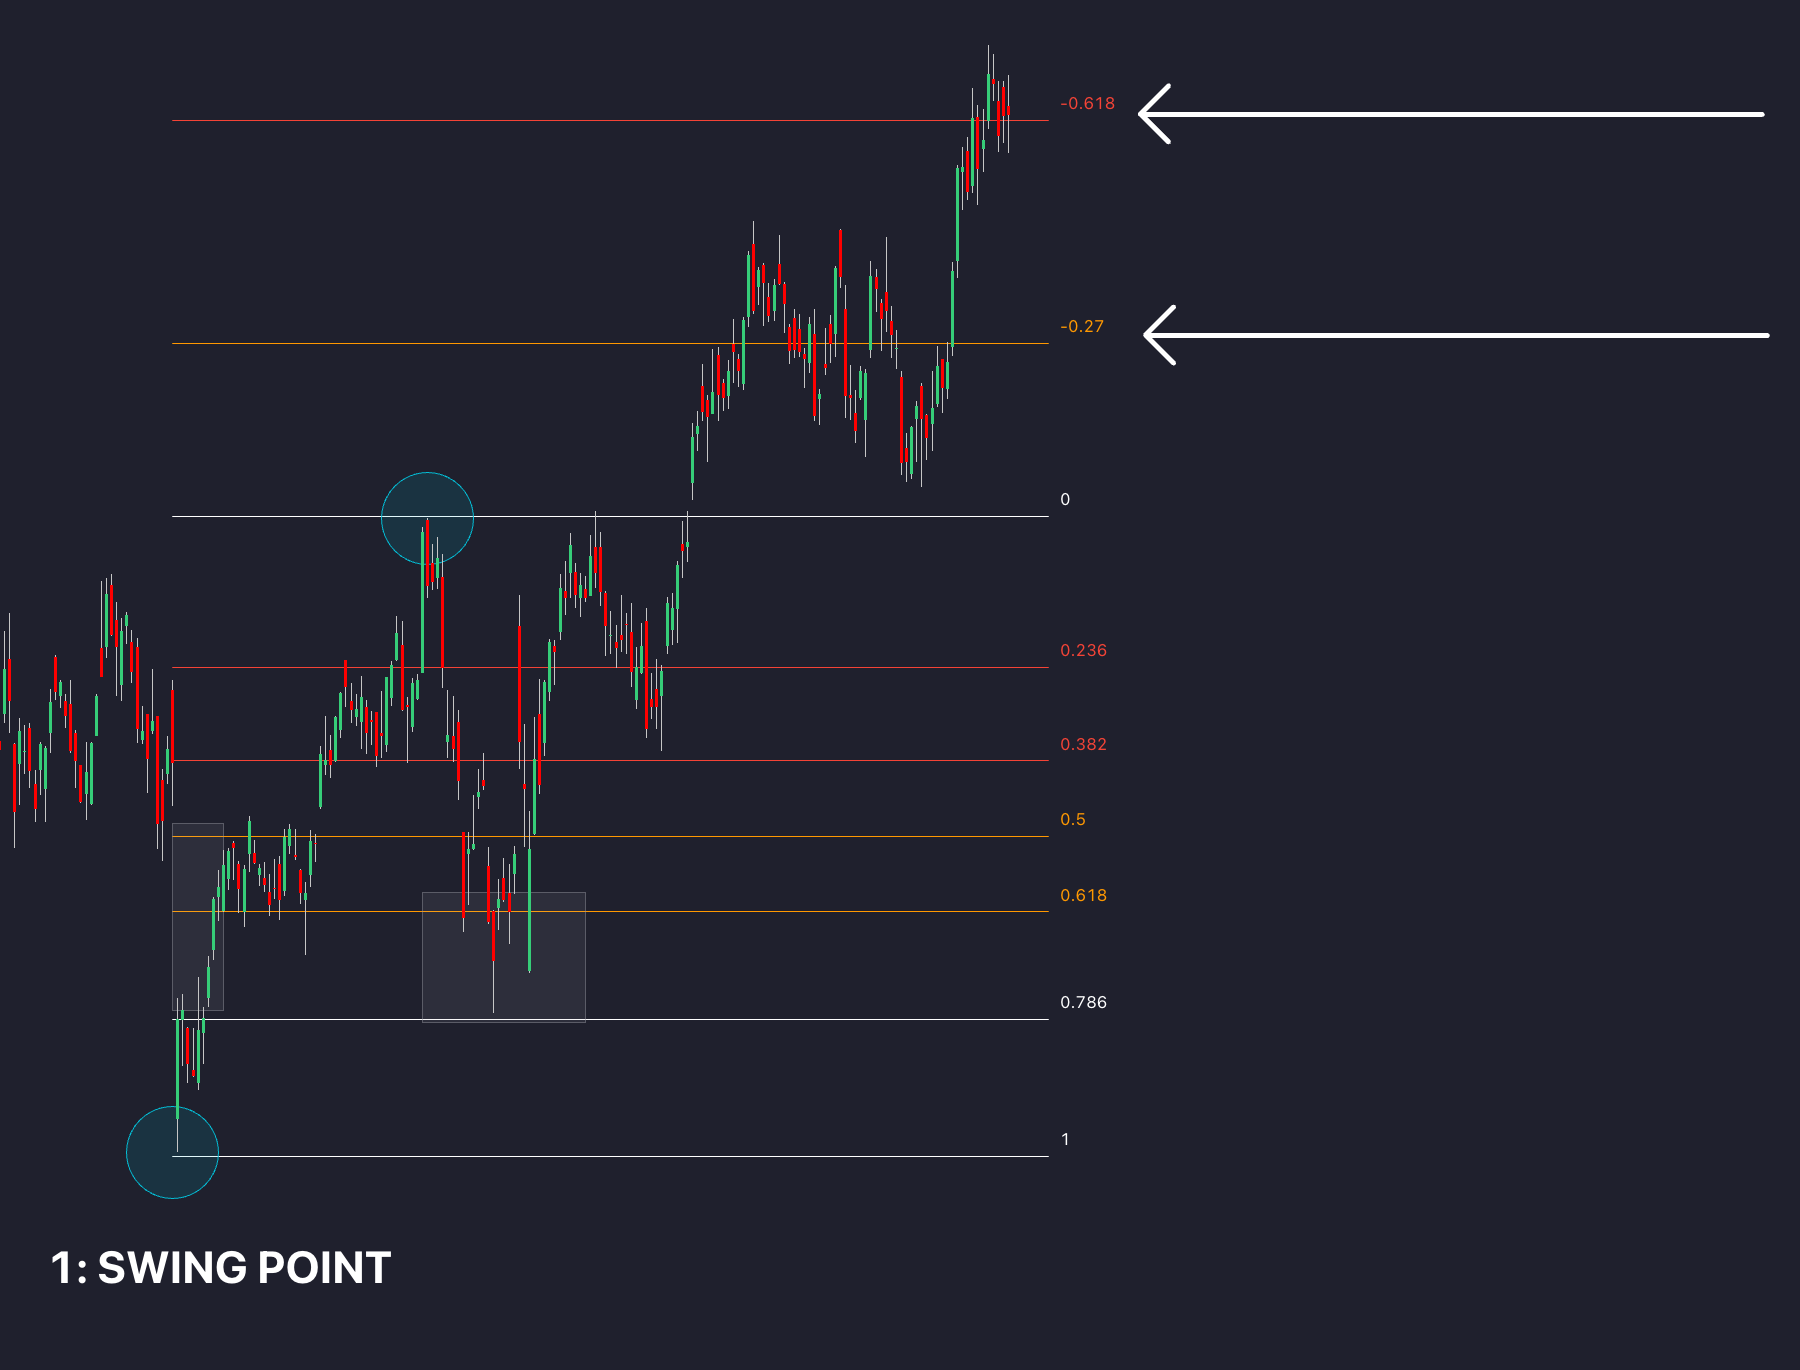
Fibonacci retracement levels are not just useful for identifying potential reversal points; they also serve as targets for taking profit. When a trader enters a position after a reversal, Fibonacci levels can help set exit points or profit-taking targets. Here’s how to identify and use Fibonacci targets effectively:
Use Fibonacci Extensions: Unlike retracements, which focus on price pullbacks, Fibonacci extensions project potential future price movement beyond the swing high or low. Popular Fibonacci extension levels include 127.2%, 161.8%, and 200%, which can act as price targets after a breakout or a reversal.
Practical Trading Tips
- Don’t Rely on Fibonacci Alone: Use Fibonacci alongside other technical tools like support and resistance, moving averages, or price action patterns to increase accuracy.
- Focus on Confluence: The more technical elements that align with a Fibonacci level, the stronger the likelihood of a reversal. Look for overlaps with key price action levels or major moving averages.
- Use Multiple Timeframes: Check Fibonacci levels on both higher and lower timeframes for added confirmation. If a 61.8% retracement aligns on the daily and 4-hour chart, it’s likely to be significant.
- Watch for Psychological Numbers: Pay attention to round numbers (like $100, $150, etc.) that may also coincide with Fibonacci levels, as these tend to attract attention from large market participants.
Common Mistakes & Limitations
- Forcing Fibonacci on Every Move: Not every swing high or low needs a Fibonacci retracement. Avoid "forcing" it onto choppy or sideways markets where there’s no clear trend.
- Ignoring Other Market Conditions: Fibonacci works best in trending markets. If the market is ranging or consolidating, these levels may not hold the same significance.
- Over-reliance on One Level: While the 61.8% level is powerful, it’s not the only one to watch. Be open to the possibility that the reversal might occur at the 38.2% or 50% level.
- Lack of Confirmation: Don’t act blindly at Fibonacci levels. Wait for price action to confirm the reversal, such as candlestick patterns or signs of strong rejections.
Conclusion
Fibonacci retracement levels offer traders a logical, visually simple way to anticipate market reversals. By understanding trader psychology and combining Fibonacci with other technical tools, you’ll be better positioned to catch high-probability reversal trades. Remember to seek confluence, remain patient, and avoid relying on a single level. Apply these principles in your chart analysis, and you’ll start to see the market’s natural rhythm unfold right before your eyes.
References
Martinez, J. F. (2007). The 10 Essentials of Forex Trading: The Rules for Turning Patterns into Profit. McGraw-Hill Education.


