Explore how volume indicators enhance trading strategies by revealing market strength, confirming trends, and identifying key price levels.
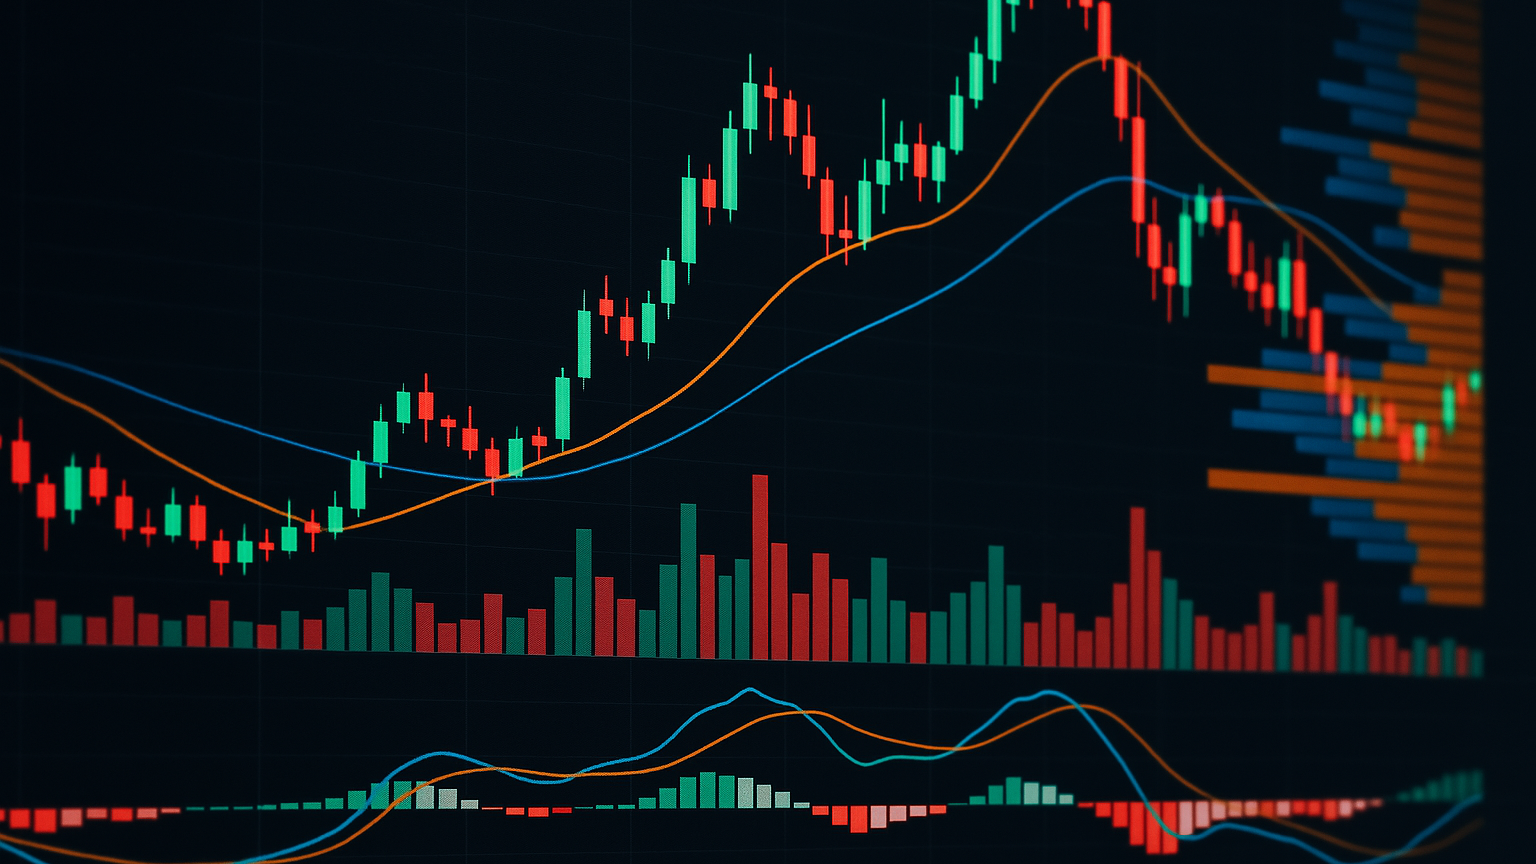
Volume indicators reveal the strength of market trends by analyzing trading activity and price movements. They help traders confirm trends, spot reversals, and identify key support or resistance levels. Here's a quick overview:
- Key Role: Volume confirms price movements and highlights market strength or weakness.
- Main Indicators:
- OBV (On-Balance Volume): Tracks volume flow to predict price changes.
- VPT (Volume Price Trend): Combines volume with price percentage changes to assess trend strength.
- CMF (Chaikin Money Flow): Measures buying/selling pressure over time.
- Advanced Tools:
- LuxAlgo Analysis Solutions: Provides advanced technical analysis on TradingView to elevate your trading decisions.
- Volume Profile: Identifies high-activity price zones for support/resistance.
Pro Tip: Rising volume with price increases signals strong trends, while divergence between price and volume may indicate reversals. Use these insights to refine your trading strategies.
How to use Volume Indicators
Main Volume Indicators
OBV, VPT, and CMF are approaches that help traders analyze trading volume and understand potential market movements. These indicators build on the idea that volume can reveal market strength and provide extra clarity on price trends.
On-Balance Volume (OBV) Analysis

Joseph Granville introduced OBV in 1963 to track volume flow and predict price changes. OBV is especially useful for spotting institutional activity, which often happens before major market shifts.
Here’s how OBV behaves in different scenarios:
| Market Condition | OBV Pattern | Trading Signal |
|---|---|---|
| Trading Range | Rising OBV | Indicates accumulation, suggesting a potential upward breakout |
| Trading Range | Falling OBV | Reflects distribution, signaling a possible downward breakout |
| Uptrend | Higher peaks/troughs | Suggests the trend will likely continue upward |
| Downtrend | Lower peaks/troughs | Indicates the trend may continue downward |
"When the security closes higher than the previous close, all of the day's volume is considered up-volume. When the security closes lower than the previous close, all of the day's volume is considered down-volume." - Fidelity
VPT takes this analysis further by incorporating percentage price changes.
Volume Price Trend (VPT) Guide
VPT combines volume data with percentage price changes. This makes it a handy approach for assessing trend strength and spotting potential reversals.
The formula for VPT is:
VPT = Previous VPT + Volume × (Today's Close - Previous Close) / Previous Close
VPT works best in these situations:
- Examining markets with high trading volume
- Confirming the strength of breakouts
- Spotting trend reversals through divergence
- Focusing on longer timeframes
Chaikin Money Flow (CMF) Methods
CMF evaluates buying and selling pressure over a set period, often 21 days. It ranges between +1 and -1, with positive values pointing to accumulation and negative values indicating distribution.
To use CMF effectively:
- Look for sustained positive readings during uptrends
- Watch for consistent negative readings in downtrends
- Pay attention to divergences between price and CMF for possible reversals
- Stick to the standard 21-day period for reliable results
CMF reflects the balance of buying and selling. Closes near the highs with strong volume suggest active buying, while closes near the lows indicate heavy selling.
Advanced Volume Tools
Volume Profile Trading
Volume Profile charts trading activity at different price levels, showing where the most transactions occur. This helps traders spot key support and resistance zones based on volume distribution.
Here are the main components of the Volume Profile:
| Component | Description | Trading Significance |
|---|---|---|
| High Volume Node (HVN) | Price level with heavy trading activity | Acts as support/resistance; potential reversal area |
| Low Volume Node (LVN) | Area with little trading activity | Indicates zones of quick price movement |
| Value Area High (VAH) | Upper boundary of high-volume area | Often a resistance level in ranging markets |
| Value Area Low (VAL) | Lower boundary of high-volume area | Often a support level in ranging markets |
These elements allow traders to go beyond basic volume data by identifying critical price zones.
"Volume Profile trading indicator gives you a wealth of important information about the price and the trading volume driving the price." - tradingsim.com
Traders often combine these insights with other approaches to fine-tune their strategies.
Multi-Indicator Volume Analysis
Using multiple volume indicators together can confirm signals and reduce the chance of false trades. Here's how to approach this:
- Base Analysis: Start with Volume Profile to map key price levels.
- Trend Confirmation: Check the overall market direction.
- Volume Validation: Ensure price movements are supported by volume.
- Time Frame Analysis: Look for patterns across different timeframes.
By comparing volume trends on multiple timeframes, traders can filter out noise and focus on reliable setups.
Volume Analysis Examples
Let's look at how traders can apply these approaches in real-world scenarios:
- Support and Resistance: High Volume Nodes often mark strong support or resistance. When prices approach these levels, they may reverse or consolidate.
- Breakouts: Low Volume Nodes indicate areas with little resistance, making them ideal for breakout strategies.
- Range Trading: Value Area High and Value Area Low serve as natural boundaries for range trading. Prices moving beyond these levels often revert to the mean.
When combined with proper risk management and a broader market understanding, these advanced insights can lead to more accurate trading decisions.
LuxAlgo Oscillator Matrix Guide
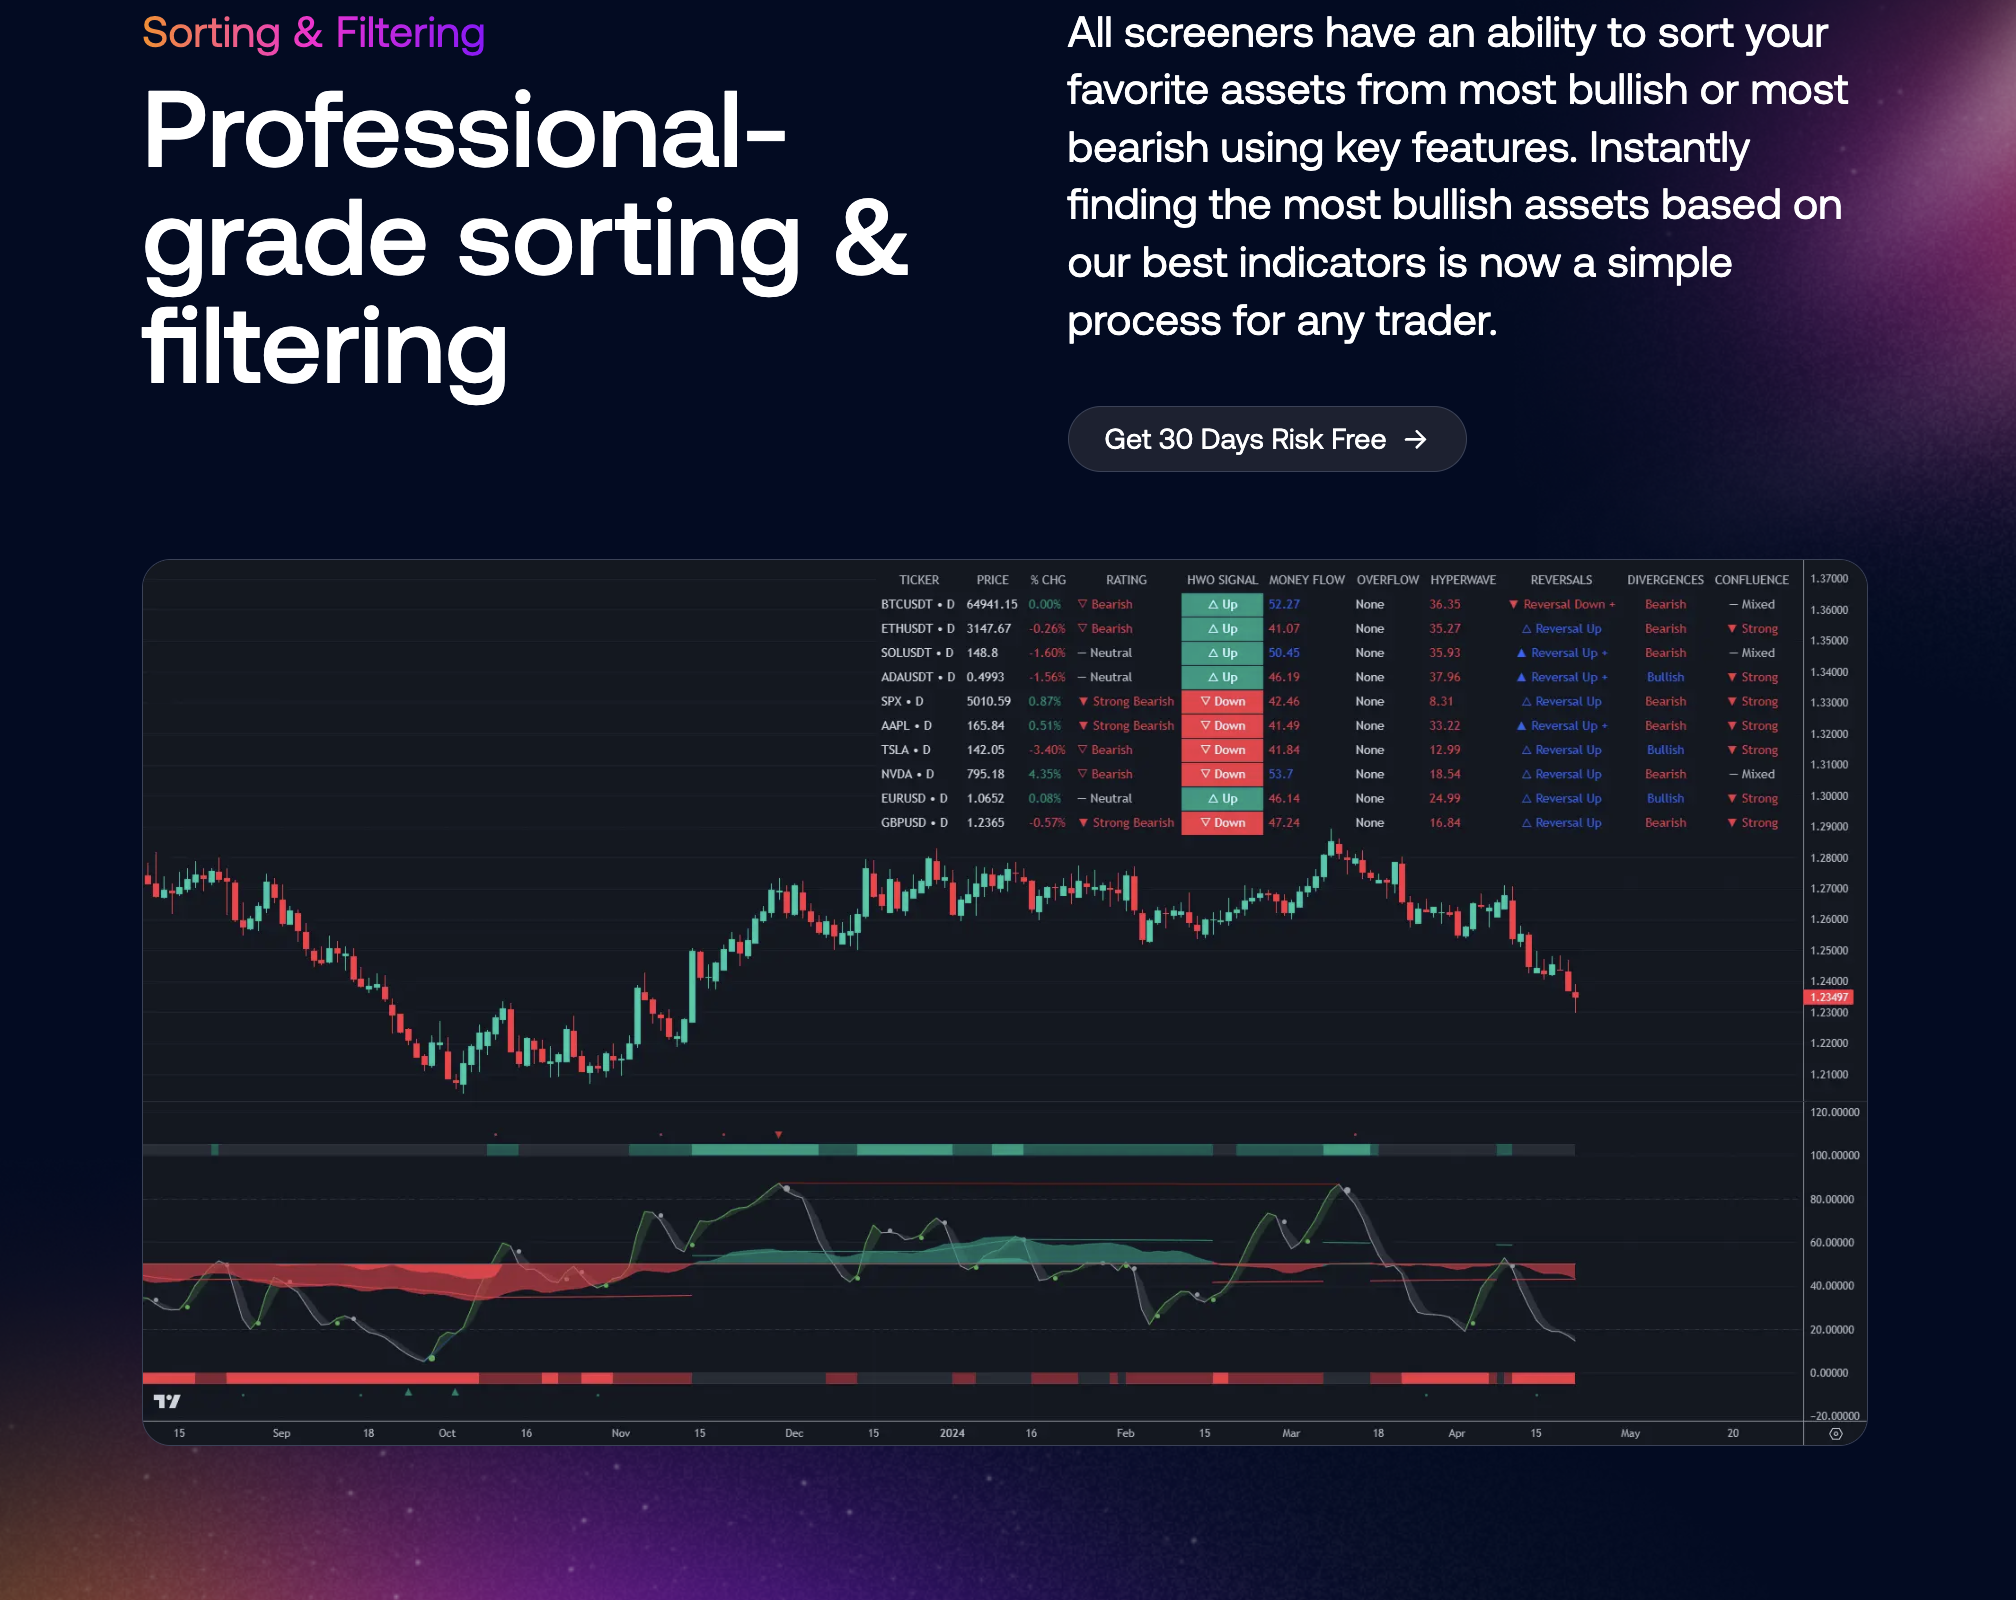
LuxAlgo transforms technical analysis on TradingView with its innovative Oscillator Matrix—a toolkit that provides a dynamic money flow indicator aimed at detecting trends based on market participants' activity. By combining hundreds of free trading indicators with exclusive analytical solutions and an AI Backtesting platform, LuxAlgo supports traders of every experience level.
| Feature | Description | Trading Application |
|---|---|---|
| Money Flow Indicator | Analyzes the flow of capital based on price momentum | Identifying emerging trends and potential reversals |
| Trend Signal Consistency | Provides longer-term trend indications to support short-term signals | Validating sustained market movements |
| Divergence Alerts | Flags discrepancies between market movements and oscillator signals | Warning of potential trend reversals |
| Institutional Activity Insights | Highlights areas with significant institutional participation | Refining entries and exits |
Testing Oscillator Matrix Strategies with LuxAlgo AI
LuxAlgo's AI Backtesting Assistant streamlines the process of creating and evaluating strategies based on oscillator signals. Here’s how it works:
-
Strategy Development
The AI scans thousands of strategies using the Oscillator Matrix to identify setups where oscillator signals align with broader market trends. Users can test these strategies with a starting capital of $10,000 across various timeframes. -
Performance Analysis
Detailed metrics allow traders to analyze historical performance and optimize their oscillator-based strategies. Results are displayed directly on TradingView charts, making adjustments seamless. -
Implementation
Once a strategy demonstrates consistent performance, traders can implement it directly on TradingView. They can fine-tune timeframes and set alerts for oscillator-based signals for real-time monitoring.
These solutions, powered by LuxAlgo’s AI Backtesting platform, integrate with TradingView to deliver actionable insights for oscillator-based trading strategies.
LuxAlgo Trading Community
LuxAlgo also supports a thriving trading community where members share strategies and insights. Key features include:
- 24/7 Live Support for technical help and strategy advice
- Strategy Forum for discussing and sharing oscillator-based setups
- Educational Resources with updates on technical analysis techniques
- Alert Templates shared by the community for quick integration
With TradingView integration, traders can immediately apply these insights, combining innovative oscillator analysis with community-driven support to refine their trading approach.
Conclusion
Main Points Review
Volume indicators play a key role in understanding market trends and guiding trading decisions. The connection between price and volume offers valuable insights into market strength. For instance, rising markets accompanied by increasing volume often signal healthy trends.
Here's a quick-reference table summarizing effective volume signals:
| Market Condition | Volume Pattern | Trading Implication |
|---|---|---|
| Uptrend | Increasing volume on price rises | Strong buying support |
| Downtrend | Rising volume on price drops | Strong selling pressure |
| Breakout | Volume spike compared to previous bars | Confirms price movement |
| Divergence | Price and volume moving in opposite directions | Possible trend reversal |
These points highlight the core dynamics of volume analysis discussed earlier.
"once you begin to interpret and understand what the price and volume relationship is signaling, then you have arrived at trading Nirvana"
This quote underscores how mastering volume analysis can turn trading into a more informed and strategic process, moving away from mere speculation.
Getting Started with Volume Analysis
You can start incorporating volume analysis into your trading by following these steps:
Examine how volume behaves alongside price movements during significant market events. For example, in an uptrend, increasing volume during price rises and decreasing volume during pullbacks often indicates strong buying interest.
"If price is the voice of the stock, volume is how loudly it speaks"
This analogy highlights why volume confirmation is crucial for validating price actions. Combining these principles with advanced analytical indicators can significantly enhance your trading approach.
To take your volume-based strategies further, consider using LuxAlgo's advanced offerings:
- PAC Toolkit: Analyze key price action and volume patterns.
- Divergence Detection Tools: Spot potential trend reversals.
- AI Backtesting Assistant: Fine-tune and optimize your strategies based on volume data.
These solutions are designed to help you apply the concepts discussed here with precision and efficiency.


