Learn how liquidity sweeps impact trading strategies, market movements, and how to identify key liquidity zones for better decision-making.
Liquidity sweeps are sharp price movements caused by large institutional trades that trigger clusters of pending buy or sell orders at specific price levels. These movements can create trading opportunities but also disrupt smaller traders. Here's what you need to know:
- What Happens: Big players execute trades that absorb market liquidity, activating stop-loss, limit, and pending orders.
- Why It Matters: Liquidity sweeps spark rapid price changes, influence market structure, and highlight areas of institutional activity.
- How to Spot: Use features like volume profile, market structure analysis, and order flow to identify liquidity zones and predict sweeps.
- Trading Strategies: Look for breakout or reversal setups around liquidity zones, and manage risk with tight stop-losses and controlled position sizes.
Understanding liquidity sweeps and using the right features can help traders anticipate price movements and improve their strategies.
Understanding Liquidity Zones
Liquidity zones are areas on trading charts where a large number of buy and sell orders are concentrated. These zones often attract price movements and are frequently targeted by institutional traders looking to capitalize on liquidity sweeps.
Key Features of Liquidity Zones
Liquidity zones have several important characteristics:
- Support, Resistance, and Order Blocks: These are specific price levels or regions where significant buying or selling pressure occurs, often resulting in sharp price movements.
- Price Consolidation Areas: When prices move sideways within a narrow range, orders accumulate, forming potential liquidity zones.
"These zones are typically highlighted by a sudden surge or drop in price, leaving behind a footprint where future price often reacts." - FXOpen Author
How to Spot Liquidity Zones on Charts
Identifying liquidity zones requires a combination of features and techniques:
- Volume Profile Analysis: This feature visualizes trading volume at different price levels. Areas with volume spikes often indicate institutional activity.
- Market Structure Analysis: Focus on key elements like:
- Previous swing highs and lows
- Round number price levels, which act as psychological barriers
- Areas where price has been sharply rejected, showing strong momentum
- Time Frame Consideration: Liquidity zones on higher timeframes tend to carry more weight and remain relevant longer than those on lower timeframes.
- Advanced Features: Platforms like LuxAlgo provide functionalities such as order flow analysis and volume profile overlays to pinpoint liquidity zones with greater accuracy.
Grasping the concept of liquidity zones is essential for understanding how institutional traders leverage these areas for liquidity sweeps, a topic we'll dive into next.
How Liquidity Sweeps Work
Liquidity sweeps play a big role in how markets move, especially when large traders or market makers are involved. These actions can impact prices and influence the behavior of other traders. Knowing how they work can give you an edge in navigating the markets.
How Large Traders Trigger Liquidity Sweeps
Big players in the market, like institutional traders, don't just jump in and out of trades. Instead, they use a calculated approach to trigger liquidity sweeps. Here's how they do it:
- Building positions quietly: They buy or sell in small increments to avoid drawing attention to their strategy.
- Watching order flow: By analyzing market data, they find the best moments to act.
- Targeting liquidity zones: They execute trades in a way that forces prices into areas where many orders are clustered.
This method allows them to influence price movement without tipping off other market participants.
Orders Affected by Liquidity Sweeps
When liquidity sweeps occur, they set off a chain reaction in the market. Different types of orders are affected, including:
- Stop-loss orders: These are triggered when the price moves against a trader's position.
- Limit orders: These activate as prices reach pre-set levels.
- Pending orders: These are executed as the price moves through specific zones.
This ripple effect can cause sudden price swings and increase market volatility, as one order's execution often leads to another.
Price Action Patterns Linked to Liquidity Sweeps
Certain price movements are closely tied to liquidity sweeps. Two common patterns traders look for are:
- Fake breakouts: The price briefly moves past a key level, triggering stop-losses, before quickly reversing direction. This traps traders who entered the market too soon.
- Sharp wicks: These appear as long tails on candlestick charts, showing that the price swept through a liquidity zone but couldn't hold there.
For traders using advanced features, platforms like LuxAlgo can help spot these patterns. Functionalities such as order flow analysis and volume profile overlays make it easier to identify potential sweep zones before they unfold.
Liquidity sweeps reveal a lot about how institutional traders operate. By understanding these moves and using the right features, traders can better anticipate price changes and position themselves to take advantage of market shifts.
Trading Approaches for Liquidity Sweeps
This section dives into strategies for spotting and trading liquidity sweeps effectively.
Predicting Liquidity Sweeps
To trade liquidity sweeps successfully, you first need to predict where they might occur. This involves analyzing market structure and order flow data to pinpoint areas with clusters of pending orders. These zones often act as magnets for liquidity sweeps.
Key areas to monitor include:
- Historical price levels and major support/resistance zones where orders tend to accumulate
- Order blocks, which can signal institutional activity
Volume profile tools are especially helpful here. For example, LuxAlgo’s market depth analysis can highlight areas with high order density, giving you a clearer idea of where sweeps might happen.
Once you’ve identified potential zones, timing becomes crucial to take advantage of these movements.
Trade Timing Around Liquidity Sweeps
Timing your trades around liquidity sweeps requires precision. Traders often rely on two main setups:
- Breakout Setup: When the price nears a liquidity zone, wait for confirmation of the sweep through strong momentum and volume. Enter after the sweep but before the main price move gains traction.
- Reversal Setup: This approach involves waiting for the sweep to finish and looking for signs of a reversal, such as fading momentum in price action. These setups can offer better risk-reward ratios since they align with the broader market direction.
Managing Risk in Liquidity Sweep Trading
Navigating the volatility of liquidity sweeps demands strong risk management. Here’s how you can protect your capital:
| Risk Management Component | How to Implement | Why It Matters |
|---|---|---|
| Position Sizing | Limit each trade to 1–2% of your capital | Prevents significant losses |
| Stop-Loss Placement | Set stops just beyond the sweep zone | Reduces early exits |
| Leverage Control | Use leverage no higher than 5:1 | Keeps risk at a manageable level |
Also, account for potential gaps and slippage in your strategy.
"Understanding these differences is crucial for traders to develop effective strategies for trading liquidity sweeps" [1][2]
Tools for Analyzing Liquidity Sweeps
Now that you know how liquidity sweeps operate, let’s look at some features that can help you spot and analyze these market events.
Volume Profile and Market Depth
Volume Profile and Market Depth are key features for locating liquidity zones. Volume Profile highlights areas with concentrated trading activity, like high-volume nodes and the Point of Control (POC), which often coincide with liquidity zones. Meanwhile, Market Depth provides real-time insights into order clustering, helping traders predict where sweeps might occur.
| Feature | Primary Use | Key Advantage |
|---|---|---|
| Volume Profile | Maps historical trading data | Pinpoints liquidity zones |
| Market Depth | Displays real-time order book | Identifies sweep targets |
LuxAlgo Liquidity Grab Feature in the Price Action Concepts Toolkit
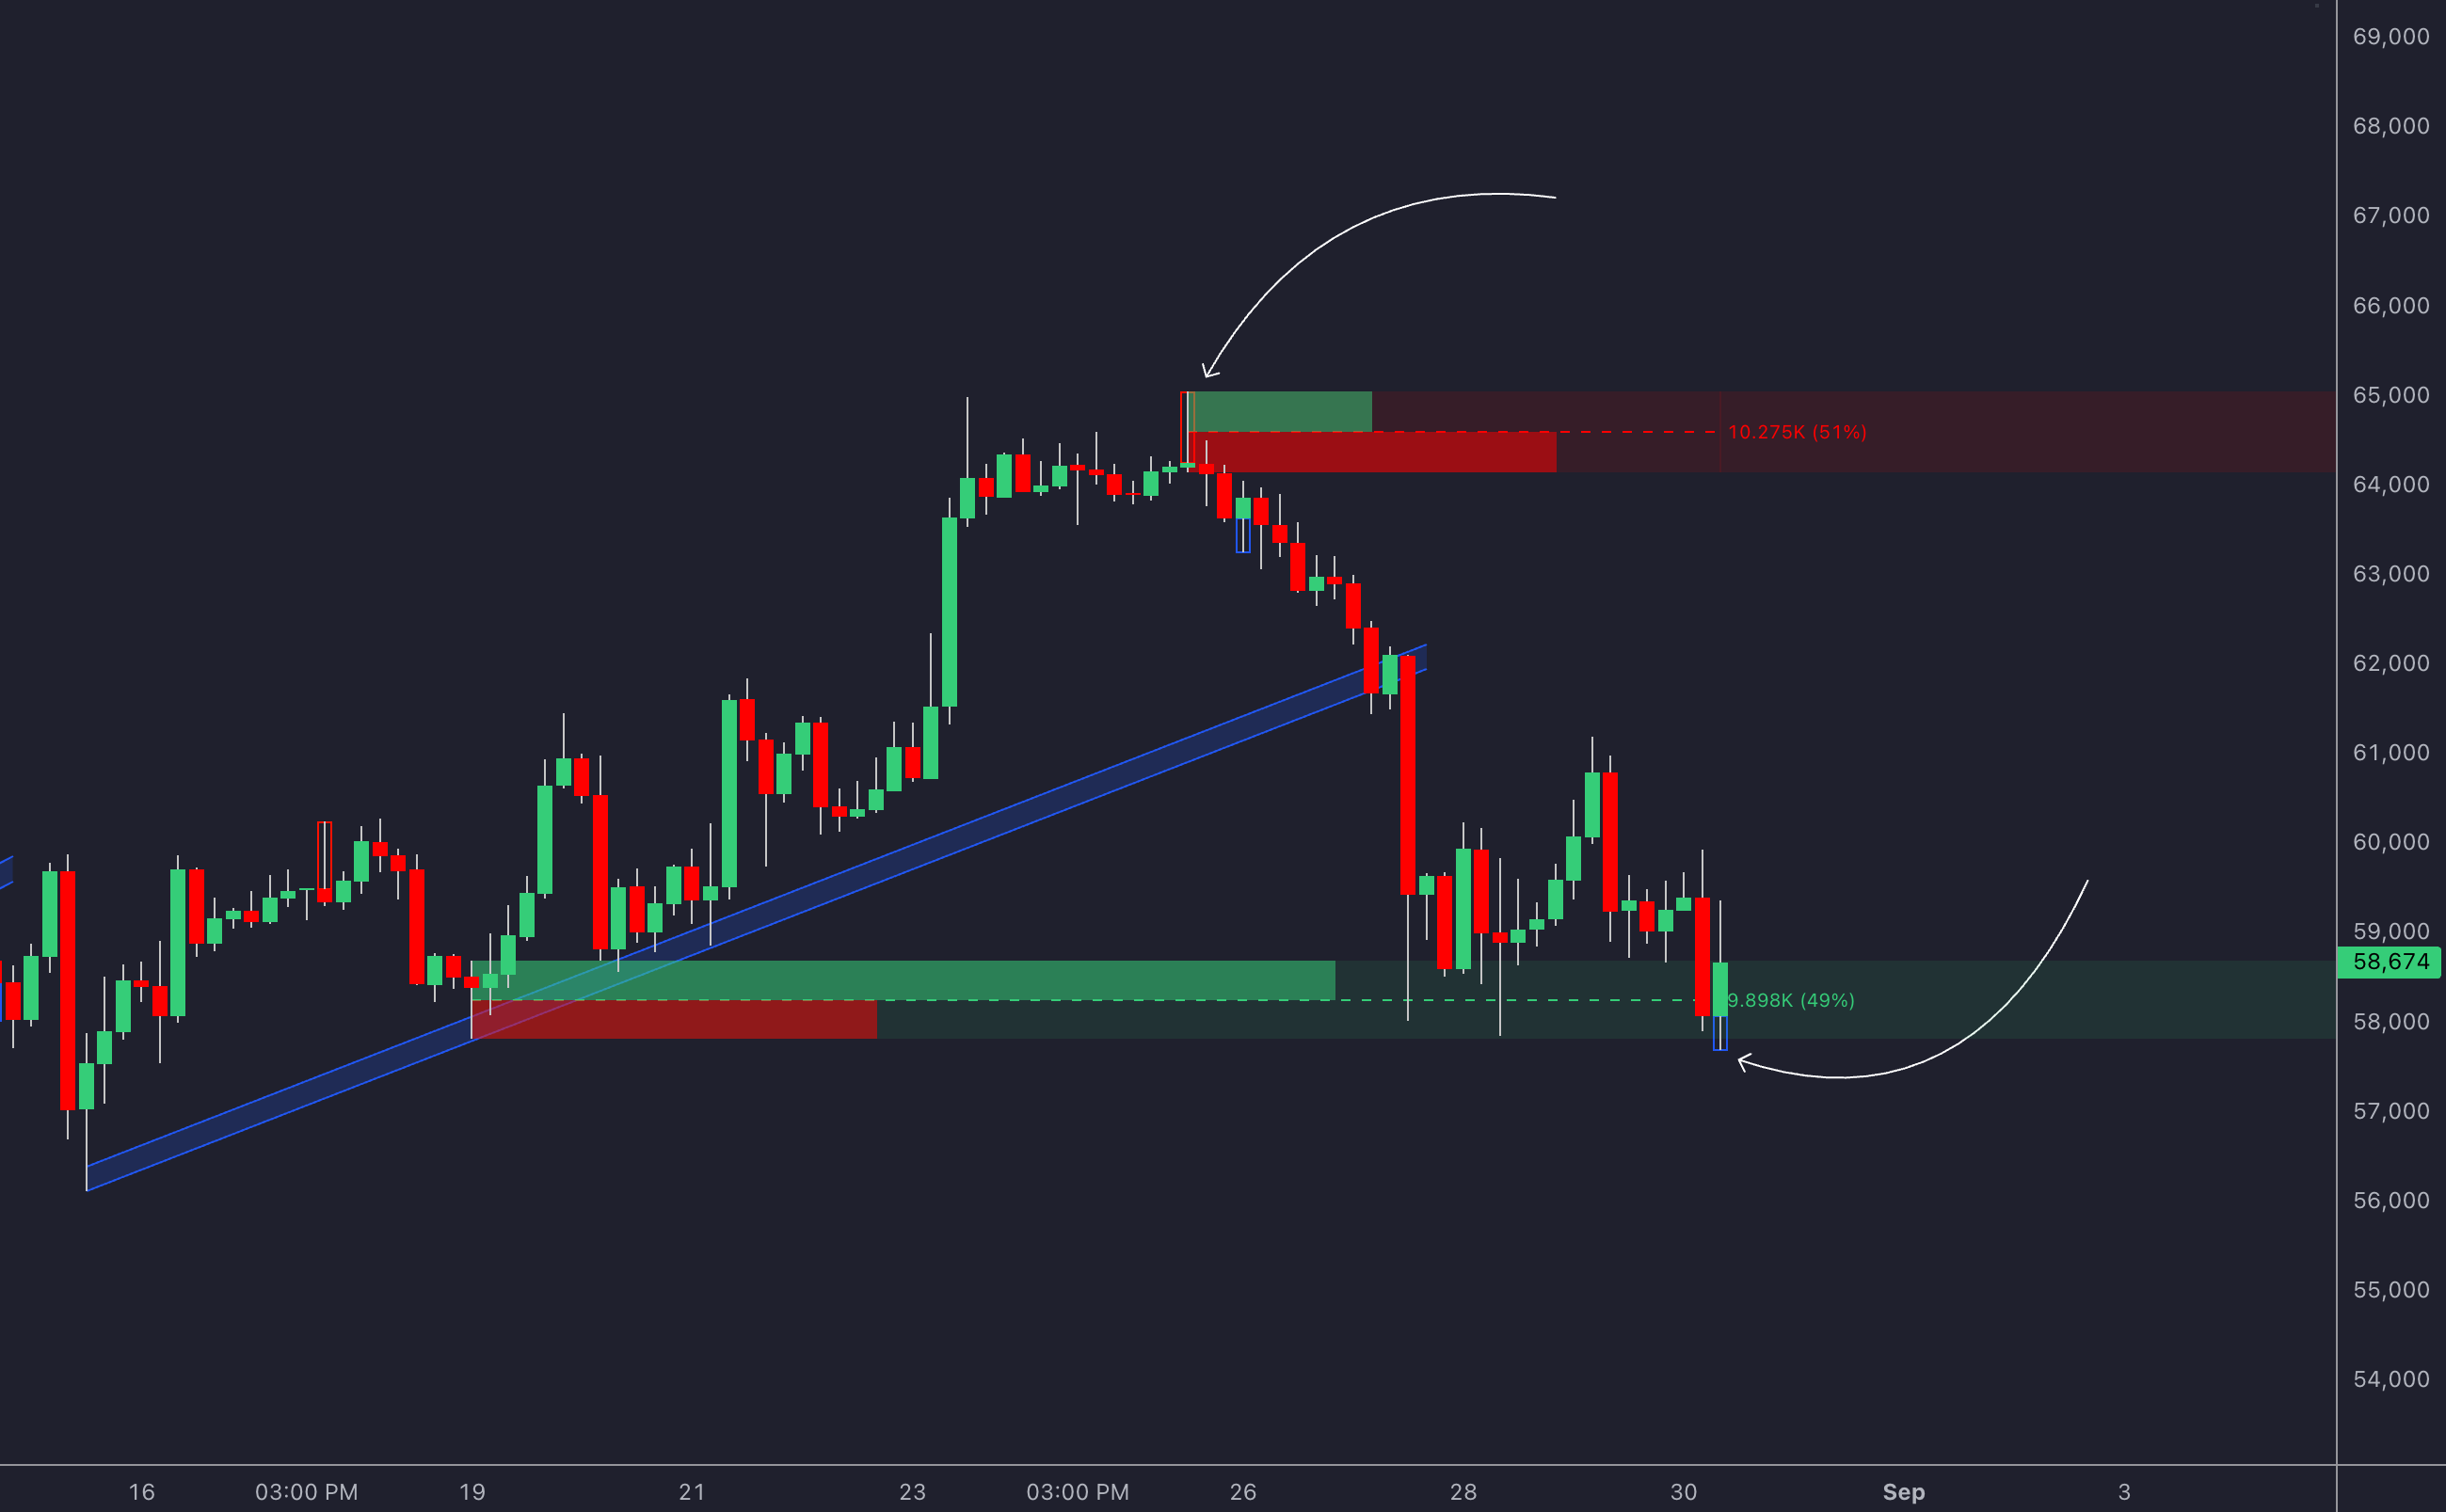
LuxAlgo’s Price Action Concepts toolkit now includes the Liquidity Grab feature, which highlights occurrences where trading activity takes place in highly liquid areas. This feature marks these grabs with colored borders to help traders quickly identify key market moves. A bullish liquidity grab is highlighted in blue—with borders ranging from the price low to the candle body minimum—indicating a potential bullish reversal. Conversely, a bearish liquidity grab is marked in red—with borders extending from the price high to the candle body maximum—signaling a potential bearish reversal. When both bullish and bearish liquidity grabs occur simultaneously, it may indicate market indecision.
Order Flow and Advanced Charting Features
Order flow features provide a closer look at buyer-seller interactions. These capabilities can help traders:
- Track large order blocks and monitor institutional activity for sweep zones.
- Spot potential sweep areas by analyzing order clustering.
Advanced charting features go a step further by combining multiple data points. For example, layering Volume Delta indicators with price action patterns can highlight high-probability sweep zones.
"Understanding liquidity sweeps offers traders a critical lens through which to view market dynamics, revealing deeper insights into potential price movements" [1]
To get the most out of these features, consider combining several of them instead of relying on just one. A multi-feature approach provides a clearer and more detailed perspective on market conditions and sweep opportunities.
Summary and Final Thoughts
What Are Liquidity Sweeps?
Liquidity sweeps are a key market activity where large institutional traders place significant orders to activate pending buy or sell orders at specific price points. This process helps create the liquidity needed for these big players to execute their trades smoothly.
| Liquidity Type | Description | Impact on Price |
|---|---|---|
| Buyside (BSL) | Stop-loss orders from short sellers | Drives prices up when triggered |
| Sellside (SSL) | Stop-loss orders from long traders | Pushes prices down when triggered |
| Combined Zones | Overlapping BSL and SSL levels | Likely areas for price reversals |
Tips for Traders
Liquidity sweeps work best when paired with technical tools like Fair Value Gaps (FVGs) or Order Blocks (OBs) to improve precision. Tools like LuxAlgo's indicators can help traders pinpoint these high-probability zones more effectively.
To manage risk while trading liquidity sweeps, consider these strategies:
- Set stop-losses beyond obvious levels to avoid being swept.
- Use the Average True Range (ATR) to determine smart stop-loss distances.
- Trade during high-liquidity periods to minimize the risk of manipulation.
- Adjust position sizes to account for the volatility that sweeps can cause.
"Understanding liquidity sweeps offers traders a critical lens through which to view market dynamics" [3]
FAQs
What happens when liquidity gets swept?
When liquidity gets swept, large market players execute high-volume trades that activate clusters of pending buy or sell orders at specific price points. This allows them to complete substantial trades while also influencing market behavior.
The effects of a sweep include:
- Sudden price changes, leading to market volatility
- Disruption of market structure, which can create opportunities for reversals or breakout trades
What is the difference between liquidity sweep and run?
Liquidity sweeps and liquidity runs differ in several ways:
| Characteristic | Liquidity Sweep | Liquidity Run |
|---|---|---|
| Direction | Targets a specific level and reverses | Continues in one direction |
| Purpose | Triggers stop orders for a reversal | Gathers liquidity for a significant move |
| Market Impact | Causes short-term volatility | Supports ongoing trend |
| Duration | Typically shorter | Can last for a longer period |
"A liquidity sweep targets a specific level to trigger stop orders and cause a reversal. A run moves in one direction without reversing, gathering liquidity before making a major move. It is seen as a continuation of the short-term trend." [3]