
Explore the Chaikin Volatility Indicator, a critical tool for traders to assess market volatility and improve trading strategies.
The Chaikin Volatility Indicator measures market volatility by analyzing the difference between high and low prices over time. It helps traders identify potential market reversals, momentum shifts, and periods of consolidation. Here's a quick breakdown:
- How It Works: Tracks the percentage change in the Exponential Moving Average (EMA) of high-low price ranges over a set period.
- Key Insights:
- Rising Values: Signals increasing volatility, often near market tops.
- Falling Values: Indicates decreasing volatility, common near market bottoms or during consolidations.
- Uses:
- Spot market tops/bottoms.
- Time trade entries and exits.
- Adjust risk strategies based on volatility levels.
- Strengths:
- Works across various markets (e.g., stocks, crypto, forex).
- Effective in volatile conditions.
- Limitations:
- Less reliable in low-volume markets.
- Requires confirmation from other tools like RSI or Bollinger Bands.
This indicator is best used alongside other complementary technical methods and customized settings to match specific market conditions.
Steps to Calculate the Chaikin Volatility Indicator
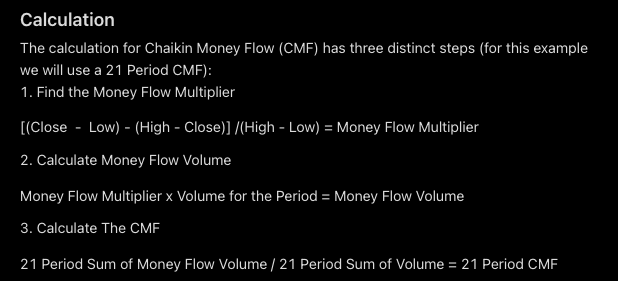
Understanding the Formula
The Chaikin Volatility Indicator is calculated in three main steps. This process gives traders a way to measure market volatility and adjust their strategies accordingly [1].
First, the high-low range is calculated for each period. Then, an EMA (Exponential Moving Average) is applied to smooth the data. Finally, the percentage change in the EMA over a set number of periods (e.g., 10 periods) is computed. This percentage change represents the Chaikin Volatility Indicator, showing how quickly market volatility is rising or falling [1] [3].
Default and Custom Parameters
The Chaikin Volatility Indicator has two key settings that traders can tweak to suit their needs:
| Parameter | Default Value | Customization Impact |
|---|---|---|
| EMA Period | 10 periods | Shorter periods make it more sensitive. |
| ROC Period | 10 periods | Longer periods smooth out the readings. |
LuxAlgo provides hundreds of free trading indicators along with exclusive trading tools and an AI Backtesting platform, enabling traders to fine-tune parameters to suit their trading strategies and market conditions.
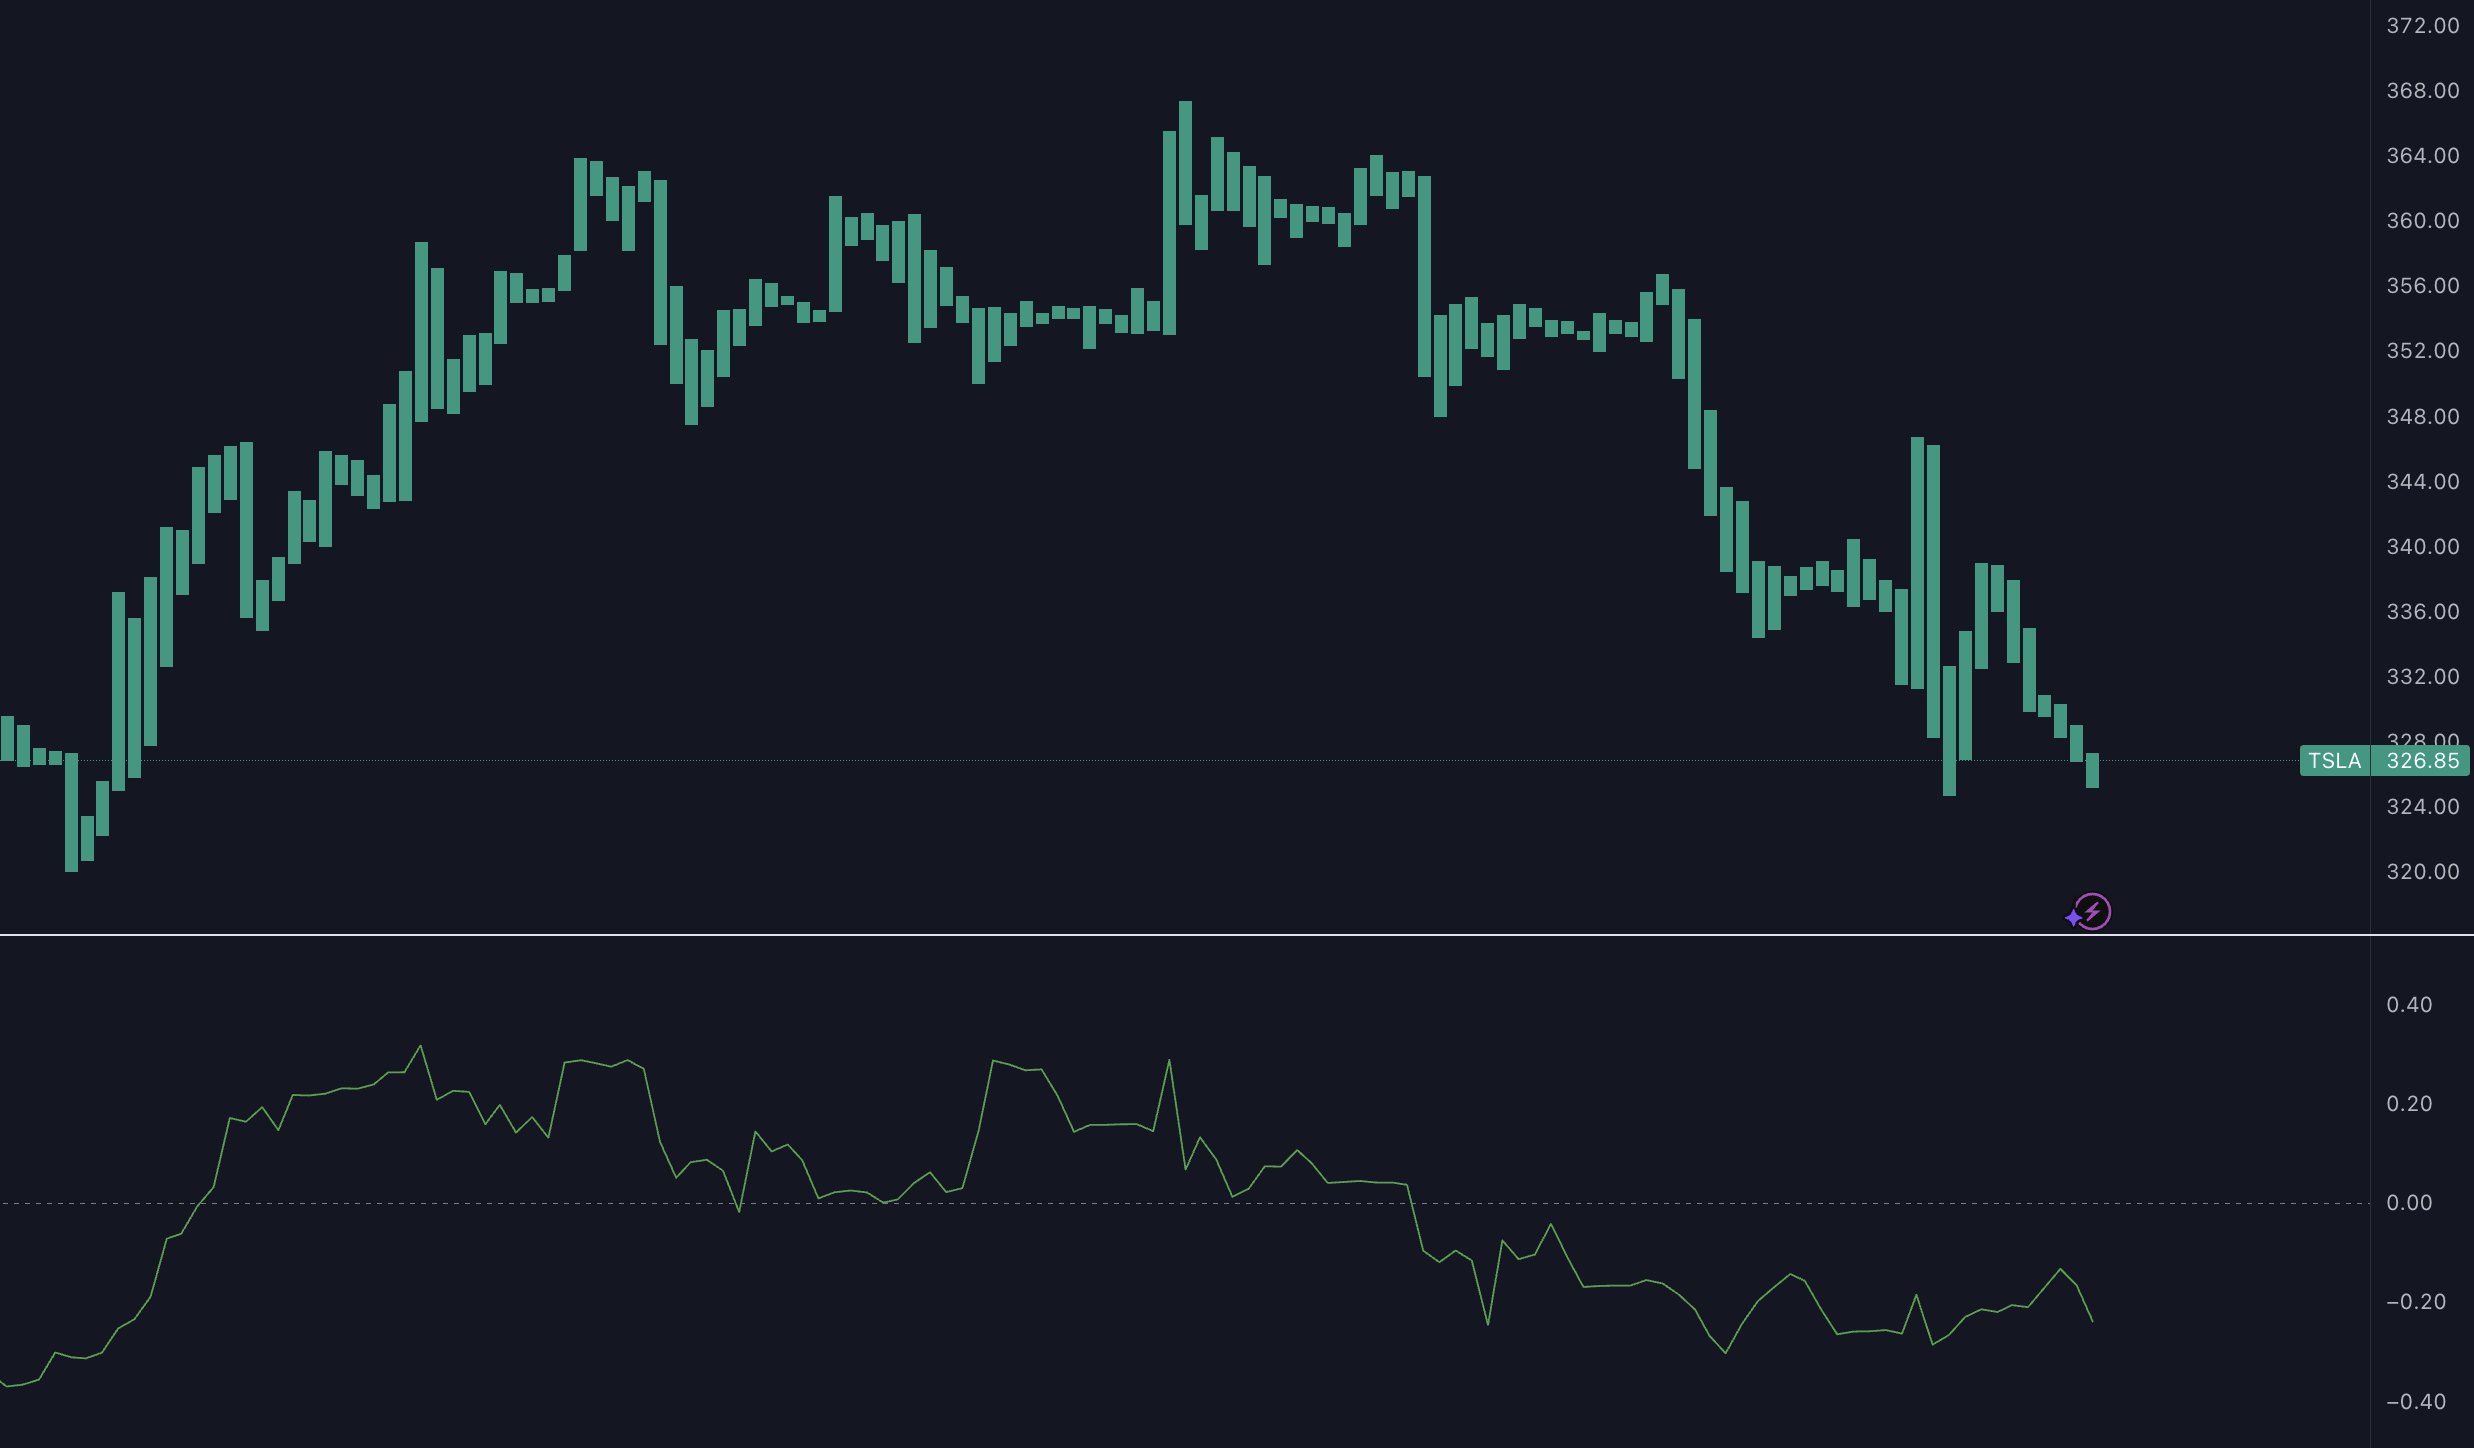
How to Interpret the Values
To make the most of the Chaikin Volatility Indicator, it's crucial to look at both its values and the broader market context:
- Rising values: These indicate growing volatility, which is often seen near market tops when uncertainty is high [1].
- Falling values: These point to decreasing volatility, commonly found near market bottoms when interest fades. Long periods of low volatility can sometimes lead to major price moves [3].
For better accuracy, traders should use this indicator alongside other technical tools to confirm signals and assess market trends [2].
Using the Chaikin Volatility Indicator in Trading
Spotting Market Tops and Bottoms
The Chaikin Volatility Indicator helps traders identify potential market reversals by analyzing changes in volatility. It highlights uncertainty at market tops and stability at bottoms, offering clues about possible turning points [1]. For instance, when volatility spikes sharply after an uptrend, it may signal a market top.
| Signal Type | Volatility Pattern | Trading Implication |
|---|---|---|
| Market Top | Sudden increase in volatility | Potential reversal of an uptrend |
| Market Bottom | Prolonged low volatility, then a spike | Possible end of a downtrend |
| Consolidation | Sustained low volatility | Prepares for a potential breakout |
While powerful on its own, the Chaikin Volatility Indicator becomes even more useful when paired with other tools for a well-rounded analysis.
Combining with Other Tools
To gain a broader perspective, combine the Chaikin Volatility Indicator with complementary tools like RSI or Bollinger Bands. These combinations can help confirm overbought or oversold conditions and validate trends.
"The Chaikin Volatility Indicator offers unique insights into market events, giving traders an edge."
For example, if the Chaikin shows a volatility spike and RSI indicates overbought conditions, it could strengthen the case for a potential reversal.
Using for Entry and Exit Points
This indicator is particularly helpful for timing trade entries and exits by tracking shifts in volatility [1] [4]. Here are some practical ways to use it:
- Entering Trades: Look for a sharp rise in volatility, as it often signals increased market activity.
- Adjusting Stop-Losses: During high volatility, use wider stop-losses to avoid getting stopped out too soon.
- Closing Positions: Consider exiting trades when volatility peaks, as it may indicate the end of a strong move.
Keep in mind that its effectiveness can vary depending on market conditions. For instance, during the Asian trading session, readings are generally lower but tend to rise as European and US markets come online. By understanding these patterns, you can better align your strategies with the market's rhythm.
Strengths and Weaknesses of the Chaikin Volatility Indicator
The Chaikin Volatility Indicator has its pros and cons, which traders should understand to use it effectively.
Advantages and Limitations Table
| Advantages | Limitations |
|---|---|
| Highlights shifts in market momentum through volatility analysis | Can produce misleading signals in low-volume markets |
| Offers early alerts for possible market reversals | Relies heavily on accurate parameter settings for best results |
| Works well with other technical indicators | Ineffective as a standalone tool |
| Adaptable to various timeframes and trading strategies | May not react quickly to sudden price changes |
| Assists in adjusting position sizes based on volatility | Needs confirmation from additional indicators |
| Performs well across different asset classes | May struggle during extreme market conditions |
The indicator’s performance can vary depending on market conditions and asset classes. It shines in volatile markets, such as cryptocurrency, where it has successfully pinpointed major tops during volatility spikes [2]. However, in low-volume periods – like holiday seasons or pre-market hours – its reliability decreases [1].
One of its standout features is its ability to work across various markets. It’s particularly effective in highly liquid environments where significant volume and price movements help generate actionable signals [2] [4]. Forex traders often combine it with trend-based tools to identify breakouts during significant economic events.
That said, its weaknesses are most evident during uncertain market phases. Adjusting the settings to align with current conditions, rather than sticking to default values, is crucial [3].
"The Chaikin Volatility Indicator can be particularly useful in identifying potential breakouts or reversals, but its effectiveness may vary depending on market conditions. For example, in highly volatile markets like cryptocurrencies, the indicator can be particularly useful in identifying potential breakouts or reversals" [2] [4].
Tips for Using the Chaikin Volatility Indicator Effectively
Best Timeframes and Markets
The Chaikin Volatility Indicator works best on shorter timeframes, such as daily charts, making it ideal for intraday and swing trading. It’s particularly effective during the overlap of the European and US trading sessions (14:00–16:00 GMT), a period known for peak market activity. Markets like cryptocurrencies and forex pairs, which are naturally more volatile, are well-suited for this indicator [1] [3].
While understanding timeframes and markets is important, managing risk effectively is just as critical when using this indicator.
Risk Management Tips
Managing risk is a key part of trading with the Chaikin Volatility Indicator. Use this simple framework to adjust your strategy based on market volatility:
| Volatility Level | Position Sizing | Stop-Loss Adjustment |
|---|---|---|
| High (Above 0) | Reduce position size by 25-30% | Use wider stop-loss levels for breakout trades |
| Low (Below 0) | Maintain standard position size | Use tighter stop-loss levels |
| Extreme Spikes | Avoid opening new positions | Wait for market conditions to stabilize |
If volatility readings are flat or minimal, it’s better to hold off on trading until activity picks up [1]. For high-volatility periods, reduce your position size and widen your stop-loss orders to keep your risk consistent [2].
Common Mistakes to Avoid
The Chaikin Volatility Indicator is a valuable indicator, but it’s not foolproof. Avoid these common mistakes to make the most of it:
- Relying on it alone: Don’t depend solely on the Chaikin Volatility Indicator. Always confirm signals using other tools like moving averages or trend lines to avoid false signals [2].
- Ignoring custom settings: Adjust the indicator’s parameters to fit the specific market and timeframe you’re trading in. Using default settings might not always yield the best results.
- Trading during low-volatility periods: Low-volatility markets often provide fewer trading opportunities, so it’s best to wait for activity to pick up [4].
To improve your results, pair this indicator with complementary tools and keep detailed trading records. This will help you identify the parameter settings that work best for your preferred markets and timeframes. A multi-indicator approach not only filters out false signals but also enhances the reliability of your trades.
Conclusion
The Chaikin Volatility Indicator is a useful method for gauging market momentum by analyzing price spreads. Its primary advantage lies in spotting market shifts and supporting effective risk management [1] [3].
Here’s where it shines:
Risk Management: By providing clear volatility readings, traders can fine-tune position sizes and set stop-loss levels that align with current market conditions [1] [4].
Market Analysis: It helps detect potential market reversals by analyzing volatility patterns. Pairing it with other tools, like moving averages, can confirm signals and reduce the chances of false alerts [4] [5].
Timeframe Flexibility: While it’s particularly effective for intraday and swing trading in shorter timeframes, the indicator works well across different market conditions and instruments. For example, the overlap between the European and US trading sessions (14:00–16:00 GMT) provides an ideal window for its application [4] [5].
To get the most out of the Chaikin Volatility Indicator, combine it with other strategies and tools, such as:
- Confirmation from other technical indicators
- Sound risk management practices
- Awareness of the broader market environment
- Regularly adjusting its parameters to match market changes
However, it’s crucial to avoid common mistakes like relying solely on this indicator or using it during unsuitable market conditions. By understanding its strengths and limitations, traders can incorporate the Chaikin Volatility Indicator into their strategies more effectively.
FAQs
What is Chaikin Volatility?
Created by Marc Chaikin, a well-known Wall Street analyst, this indicator is used in technical analysis to measure market volatility by observing changes in price range over time [3]. It’s particularly useful during periods of intense market activity, like when the European and US trading sessions overlap [4].
Here’s how it works:
- High readings: Indicate increased volatility, which could point to potential market reversals.
- Low readings: Suggest a calmer market, often signaling that a trend is stabilizing or nearing its end [1] [3].
Traders often pair this indicator with tools like moving averages or price envelopes to validate trading signals and make more informed decisions [5].
References
- Chaikin Volatility Indicator - cTrader Help
- Chaikin Volatility Indicator - TrendSpider Learning Center
- Volatility - Fidelity Learning Center
- Effective Trading Strategies Using Chaikin Volatility
- Understanding Chaikin Volatility - Morpher Blog
- What is a Chaikin Volatility Indicator in Trading? - FXOpen Blog
- LuxAlgo Liquidation Levels


