


Introduction
Support and resistance are two of the most basic but powerful concepts in trading. Understanding these levels can give traders valuable insights into potential market reversals, entry and exit points, and overall market sentiment. While the terms are simple, actually using them correctly requires a better understanding of market psychology and price action.
We’re gonna explore what support and resistance are, how to spot them, and, most importantly, how to use them to make smarter trading decisions.
What Are Support and Resistance?
Support and resistance are basically price levels where the market tends to pause or reverse because of a bunch of buying or selling at that level.
- Support: This is the price level where demand is strong enough to stop the price from going lower. It’s where buyers typically step in to purchase, causing the price to "bounce" off this level.
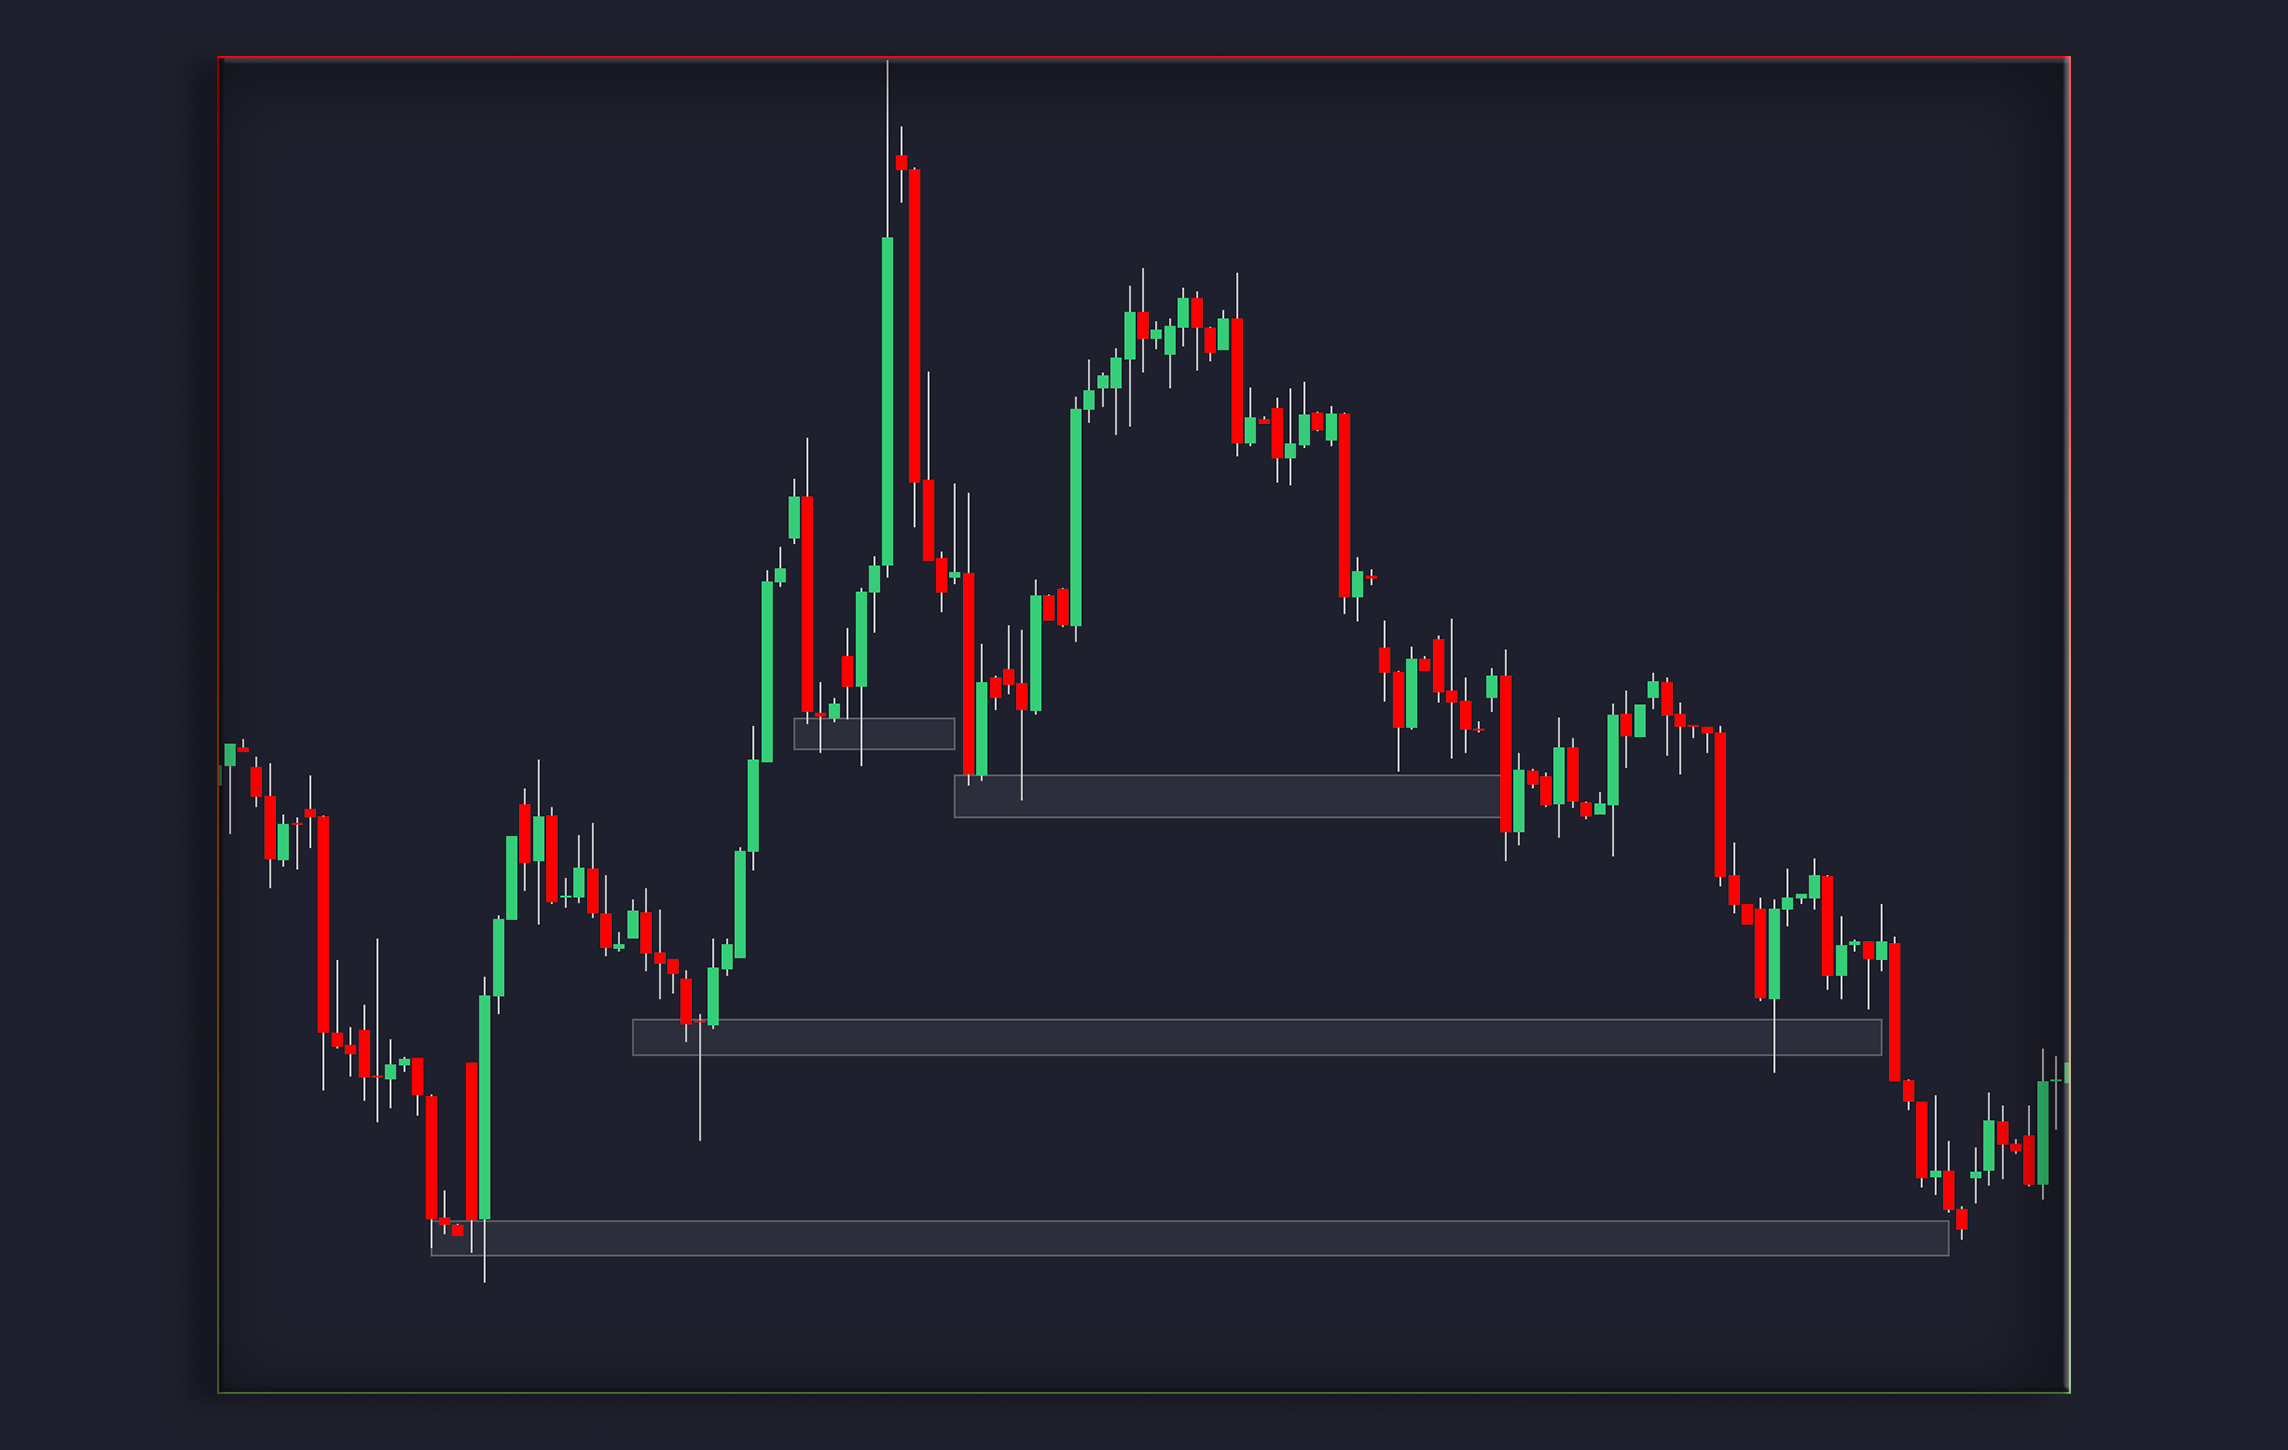
- Resistance: This is the price level where selling pressure is strong enough to stop the price from going higher. It’s where sellers typically enter the market, causing the price to "bounce" downward.
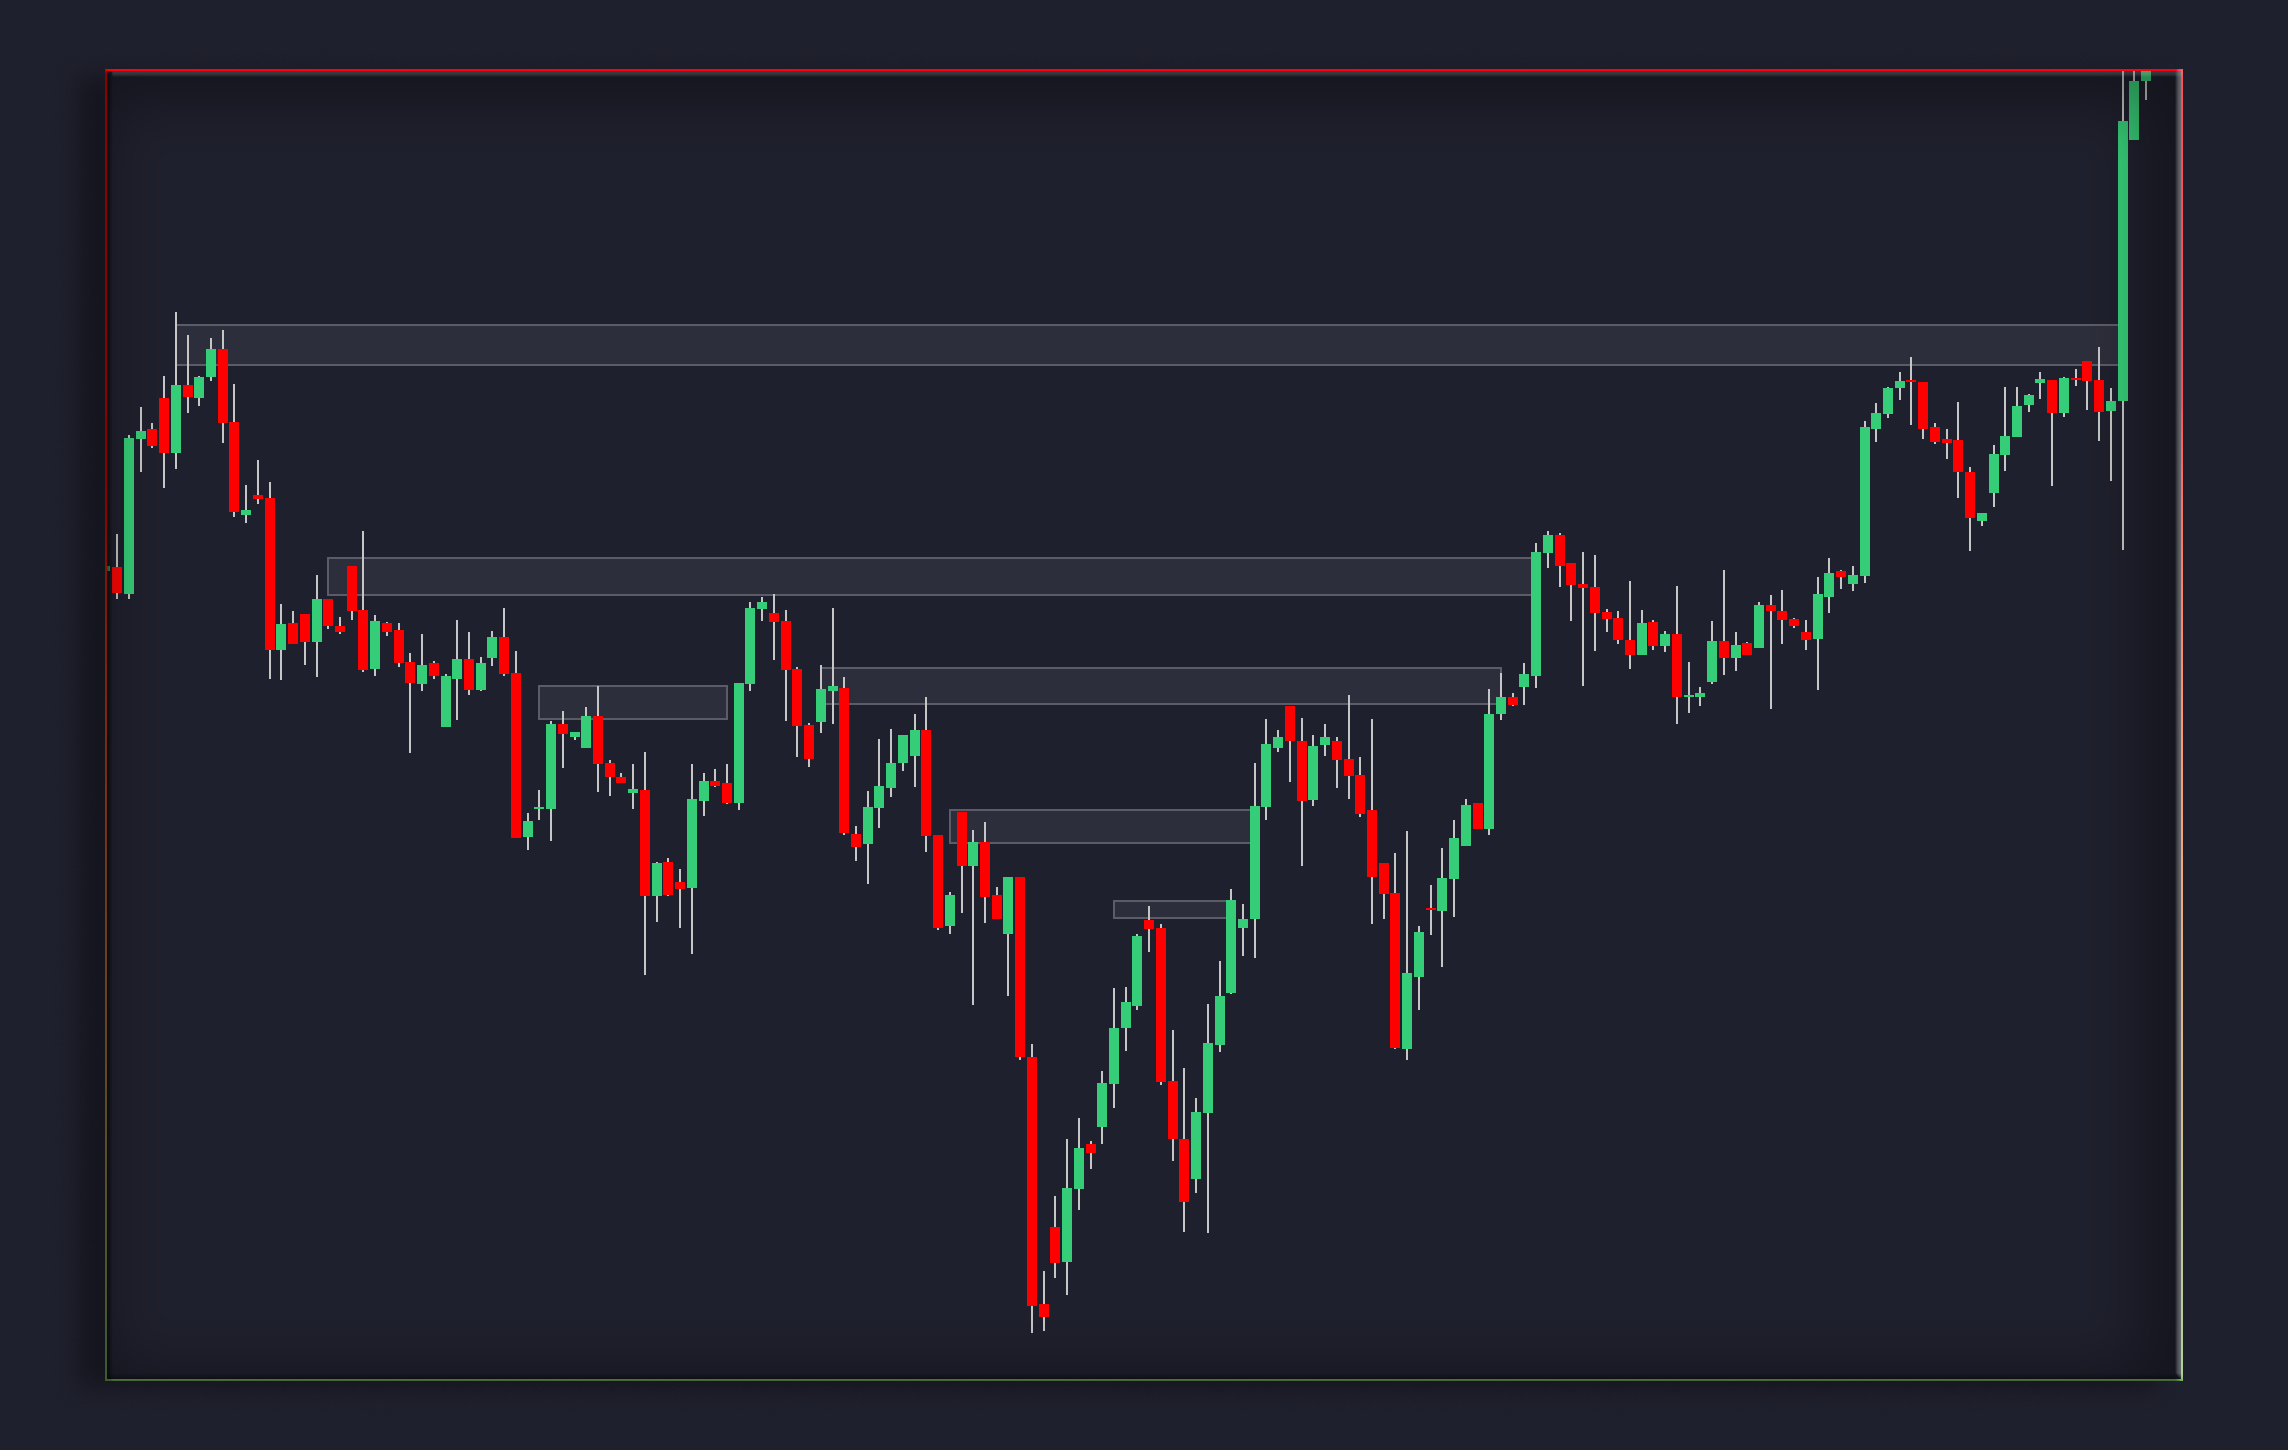
Support and resistance levels aren't always exact numbers but are often zones where price action hangs around.
How to Identify Support and Resistance Levels
- Swing Highs and Swing Lows: Look for areas on the price chart where the market reverses. Swing highs often mark resistance, while swing lows mark support.
- Historical Price Data: Check past price action to spot levels where the market has reversed a bunch of times. If a price point has been tested multiple times, it’s probably an important support or resistance level in the future.
- Psychological Whole Numbers: Prices ending in .00 or .50 often act as support and resistance because they’re "mental barriers" for traders (e.g., 1.2000 in EUR/USD).
- Technical Indicators: Tools like moving averages, Bollinger Bands, and Fibonacci retracement levels can act as dynamic support and resistance levels.
- Trendlines and Channels: Uptrend and downtrend lines act as support and resistance. In an uptrend, the support is the trendline below the price, and in a downtrend, the resistance is the trendline above the price.
- Support Turns Resistance (and Vice Versa): Once a support level is broken, it’s often gonna become resistance, and when a resistance level is broken, it can become support. This concept is important for understanding "flip zones."
The Role of Support and Resistance in Market Psychology
Support and resistance are heavily tied to trader psychology. Here’s how:
- Support: When prices fall to a support level, buyers see it as a "bargain" and step in to buy, driving the price up. Sellers who missed the chance to exit at higher levels might close their positions to avoid further loss, adding to the buying pressure.
- Resistance: When prices rise to a resistance level, sellers see it as a chance to "cash out" and lock in profits. Traders who entered short positions earlier might add more to their positions at resistance points.
This repetitive behavior is what makes support and resistance levels so reliable in technical analysis.
How to Trade Support and Resistance
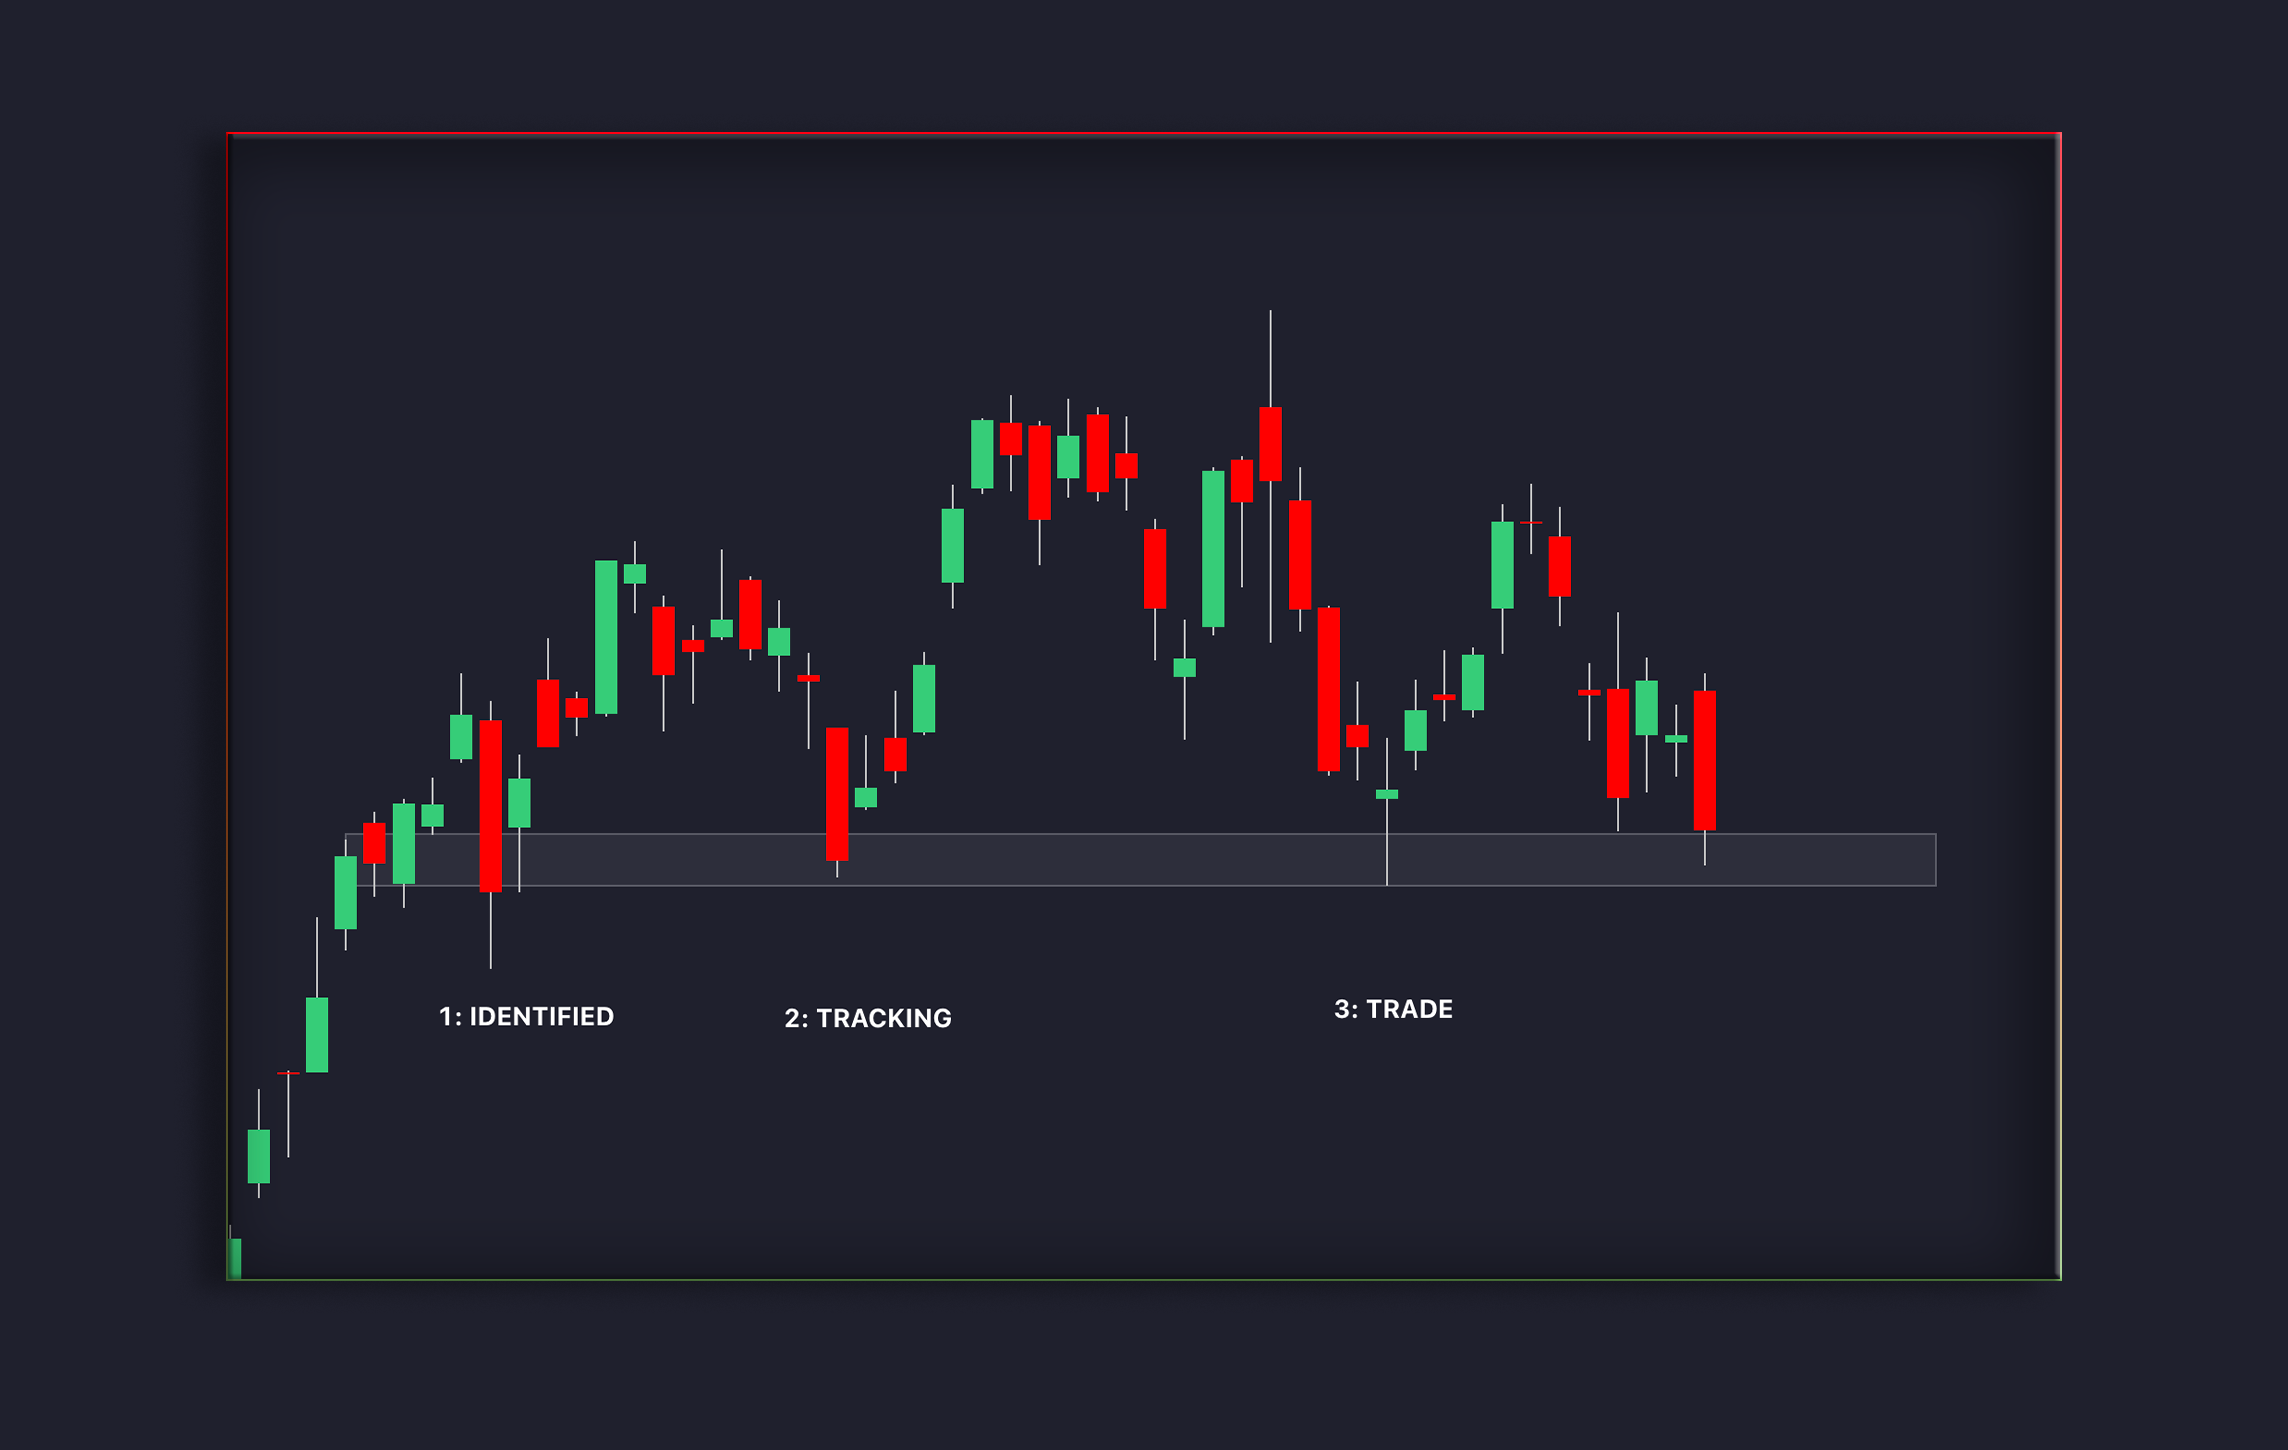
- Bouncing Strategy
- Buy at Support: When price approaches a support level and shows signs of a bounce, traders can place buy orders.
- Sell at Resistance: When price approaches resistance and shows signs of a reversal, traders can place sell orders.
- Stop Loss: Place stop-loss orders just below the support or above the resistance to protect against false breakouts.
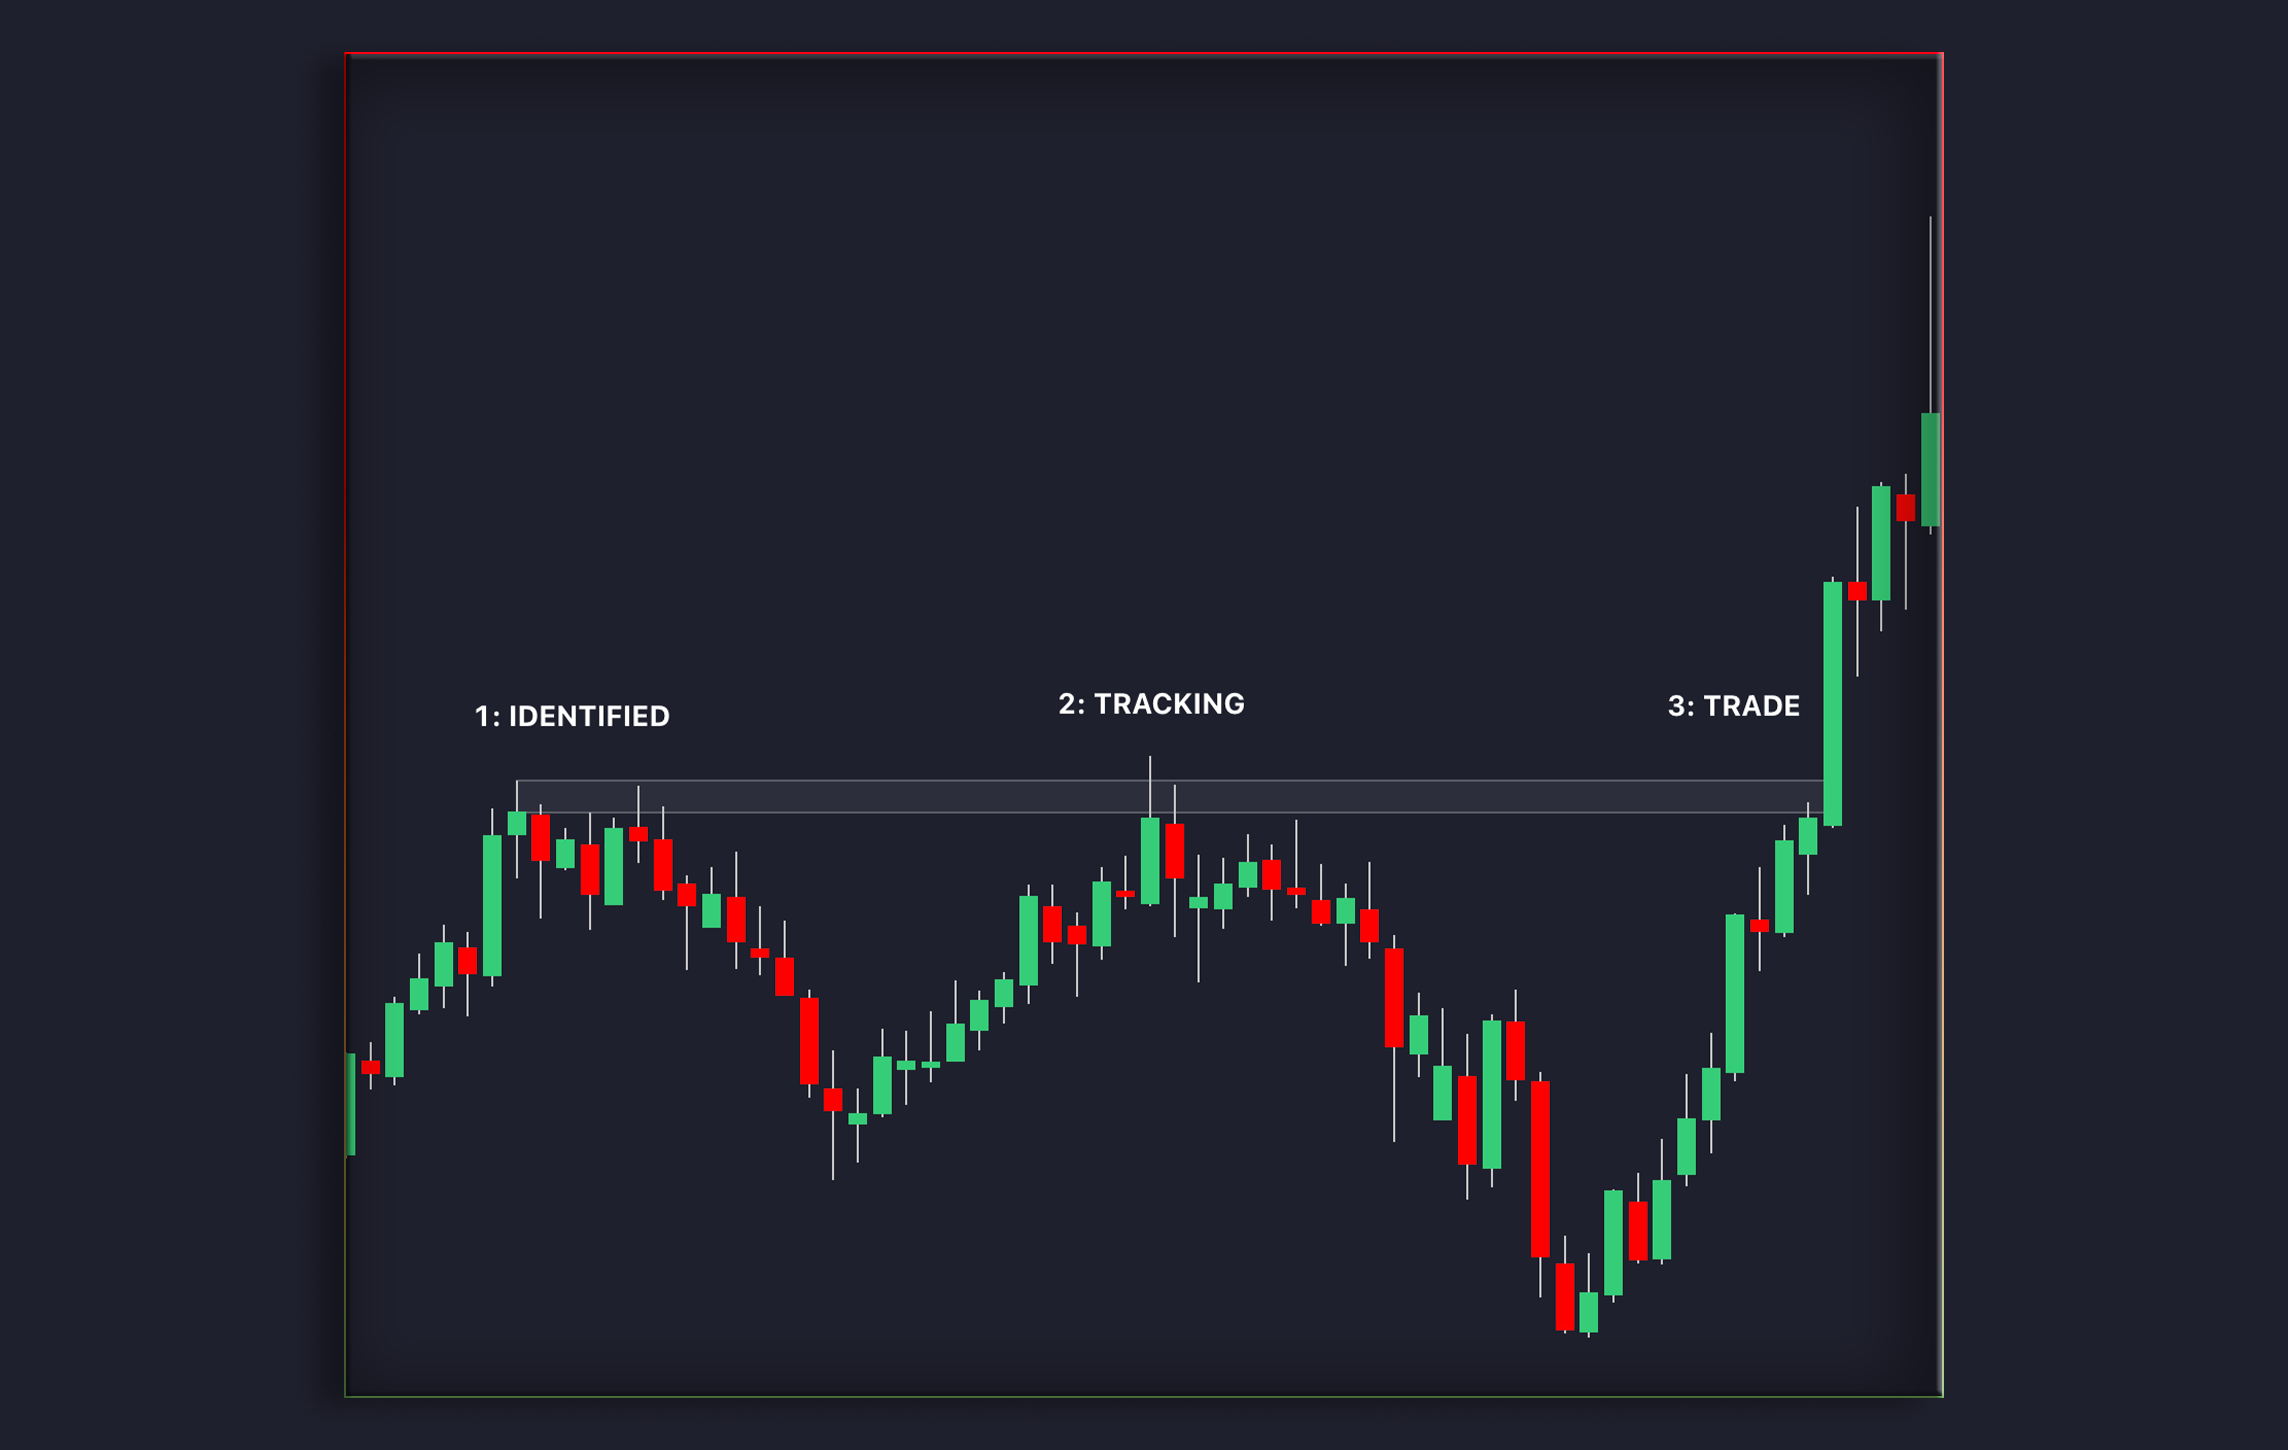
- Breakout Strategy
- Trade the Break: When price breaks through support or resistance with strong momentum, it usually means a new trend is starting.
- Retest Entries: After a breakout, the market might "retest" the broken level, which now acts as a new support or resistance. Traders can enter on the retest for a higher-probability trade.
- Stop Loss: Place stop-loss orders on the opposite side of the broken level in case the breakout fails.
Common Mistakes to Avoid
- Ignoring False Breakouts: Sometimes, the market "fakes out" traders by breaking through support or resistance before reversing. Always wait for confirmation of a true breakout.
- Placing Entries Too Early: Wait for price action confirmation, like bullish or bearish candlestick patterns, before entering a trade.
- Not Using Confluence: Relying only on support and resistance is risky. Combine them with other technical indicators, like Fibonacci retracements, moving averages, or candlestick patterns, to increase your chance of success.
- Overcomplicating Analysis: Too many support and resistance levels on a chart can cause confusion. Focus on the most critical and well-tested levels.
Advanced Tips for Mastering Support and Resistance
- Multiple Time Frame Analysis: Check support and resistance on multiple timeframes. A level seen on a daily chart carries more weight than one on a 5-minute chart.
- Dynamic Support and Resistance: Moving averages, Bollinger Bands, and Fibonacci levels are examples of dynamic support and resistance that change over time.
- Look for Confluence: The strongest support and resistance zones are those that align with multiple technical tools (e.g., Fibonacci retracement level + psychological level).
Closing
Support and resistance is one of the most essential skills in trading. By understanding how to identify key levels and how to trade them effectively, traders can increase their chances of success. Remember to always wait for price action confirmation, use proper risk management, and avoid the common pitfalls of trading these levels. With patience and practice, you’ll develop the skills to spot and trade support and resistance like a pro.