Inversion Fair Value Gaps (IFVG)

Works on the Following Platforms
The Inversion Fair Value Gaps (IFVG) indicator is based on the inversion FVG concept by ICT and provides support and resistance zones based on mitigated Fair Value Gaps (FVGs).
USAGE
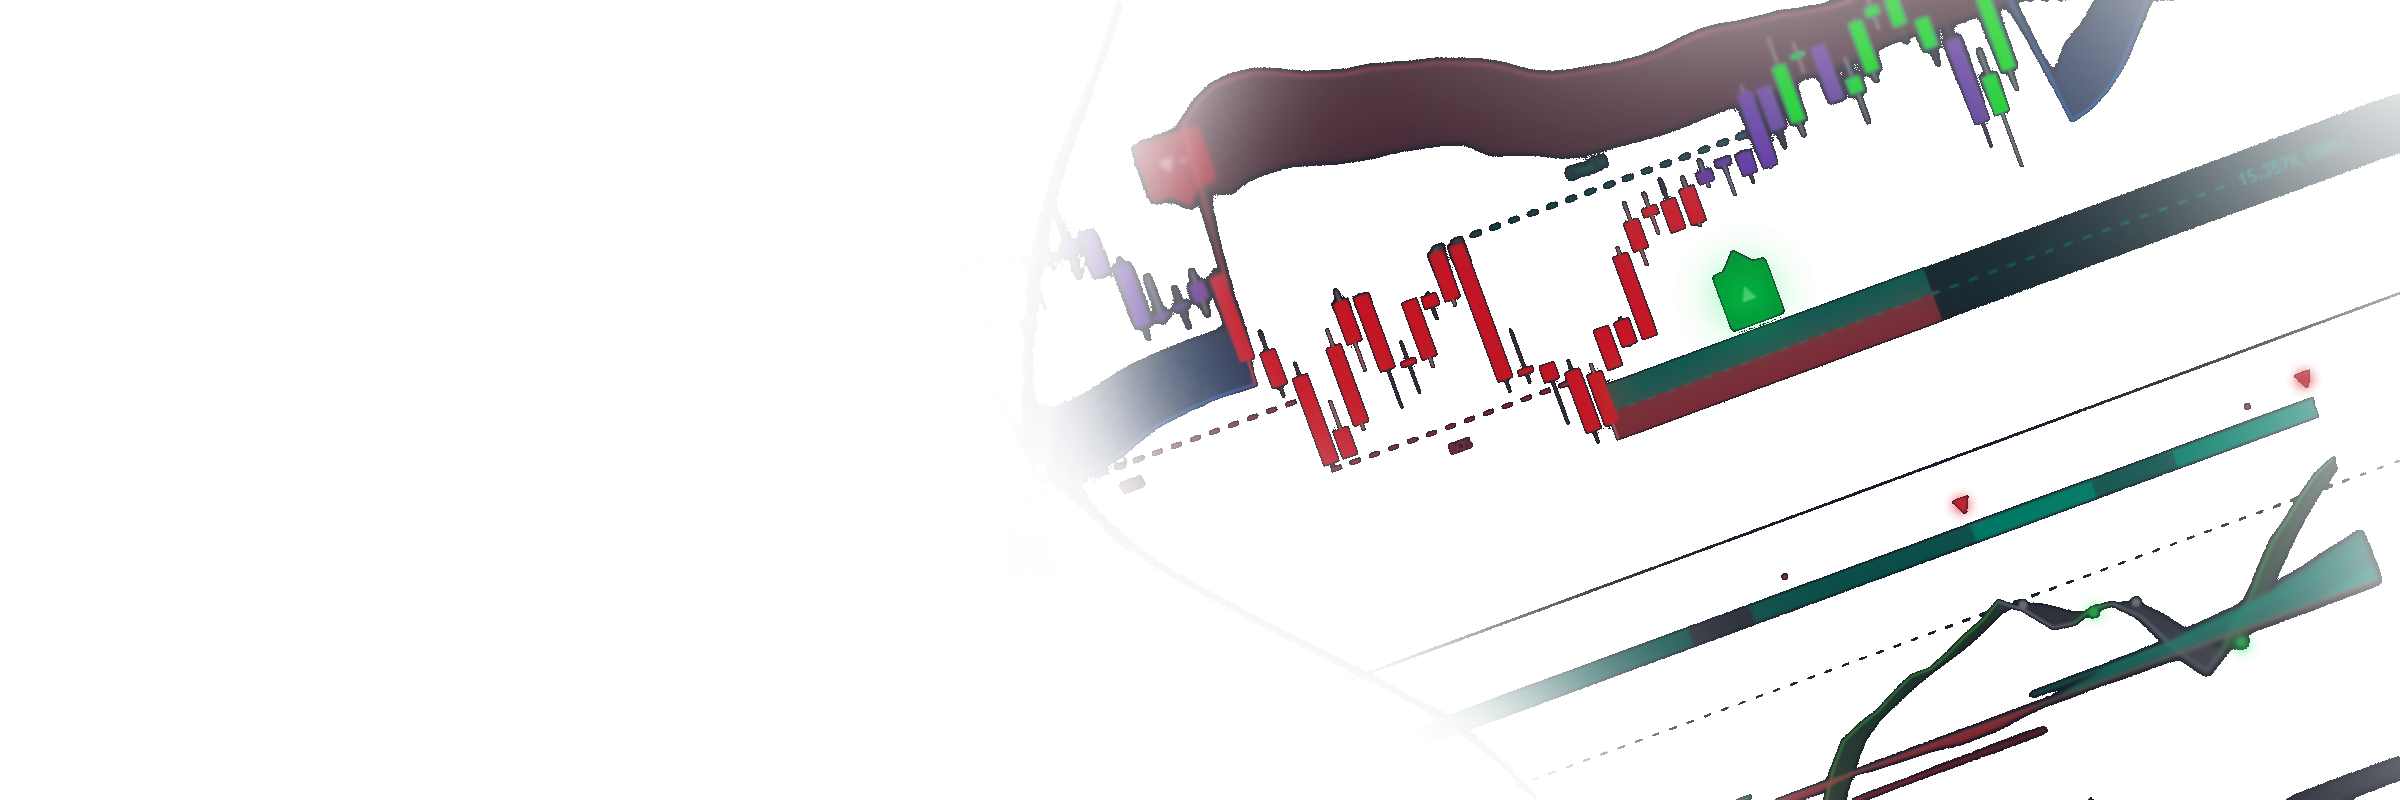
Once mitigation of an FVG occurs, we detect the zone as an "Inverted FVG". This would now be looked upon for potential support or resistance.
Mitigation occurs when the price closes above or below the FVG area in the opposite direction of its bias.
- Inverted Bullish FVGs Turn into Potential Zones of Resistance.
- Inverted Bearish FVGs Turn into Potential Zones of Support.
After the FVG has been mitigated, returning an inversion FVG, a signal is displayed each time the price retests an IFVG zone and breaks below or above (depending on the direction of the FVG).
Keep in mind how IFVGs are calculated and displayed. Once price mitigates an IFVG, all associated graphical elements such as areas, lines, and signals will be deleted.
This indicator is not meant to be just a 'signal indicator'. Backtesting historical signals is incorrect as it does not consider the mitigation of IFVGs, which is a standard method for trading IFVGs & various concepts by ICT.
The signals displayed are meant for real-time analysis of current bars for discretionary analysis. Current confirmed retests of unmitigated IFVGs are still displayed to show which IFVGS have had significant reactions.
SETTINGS
- Show Last: Specifies the number of most recent FVG Inversions to display in Bullish/Bearish pairs, starting at the current and looking back. Max 100 Pairs.
- Signal Preference: Allows the user to choose to send signals based on the (Wicks) or (Close) Prices. This can be changed based on user preference.
- ATR Multiplier: Filters FVGs based on ATR Width, The script will only detect Inversions that are greater than the ATR * ATR Width.
ALERTS
This script includes alert options for all signals.
Bearish Signal
- A bearish signal occurs when the price returns to a bearish inversion zone and rejects to the downside.
Bullish Signal
- A bullish signal occurs when the price returns to a bullish inversion zone and bounces out of the top.
Trading is risky and many will lose money in connection with trading activities. All content on this site is not intended to, and should not be, construed as financial advice. Decisions to buy, sell, hold or trade in securities, commodities and other markets involve risk and are best made based on the advice of qualified financial professionals. Past performance does not guarantee future results.
Hypothetical or Simulated performance results have certain limitations. Unlike an actual performance record, simulated results do not represent actual trading. Also, since the trades have not been executed, the results may have under-or-over compensated for the impact, if any, of certain market factors, including, but not limited to, lack of liquidity. Simulated trading programs in general are designed with the benefit of hindsight, and are based on historical information. No representation is being made that any account will or is likely to achieve profit or losses similar to those shown.
Testimonials appearing on this website may not be representative of other clients or customers and is not a guarantee of future performance or success.
As a provider of technical analysis tools for charting platforms, we do not have access to the personal trading accounts or brokerage statements of our customers. As a result, we have no reason to believe our customers perform better or worse than traders as a whole based on any content or tool we provide.
Charts used on this site are by TradingView in which the majority of our tools are built on. TradingView® is a registered trademark of TradingView, Inc. www.TradingView.com. TradingView® has no affiliation with the owner, developer, or provider of the Services described herein.
This does not represent our full Disclaimer. Please read our full disclaimer.
© 2025 LuxAlgo Global, LLC.