


Volume Profile (Maps)
Aug 23, 2023
The Pine Script developers have introduced a groundbreaking feature called "maps" within their Volume Profile indicator, known as "Volume Profile (Maps)". This innovative trading indicator showcases volume distribution in relation to price, distinguishing volumes above or below the current price. By emphasizing the highest and second-highest volumes, traders can pinpoint potential support and resistance levels. The "maps" system enhances volume analysis, making it more accessible and insightful for traders.
How to Trade the Volume Profile (Maps) Trading Indicator?
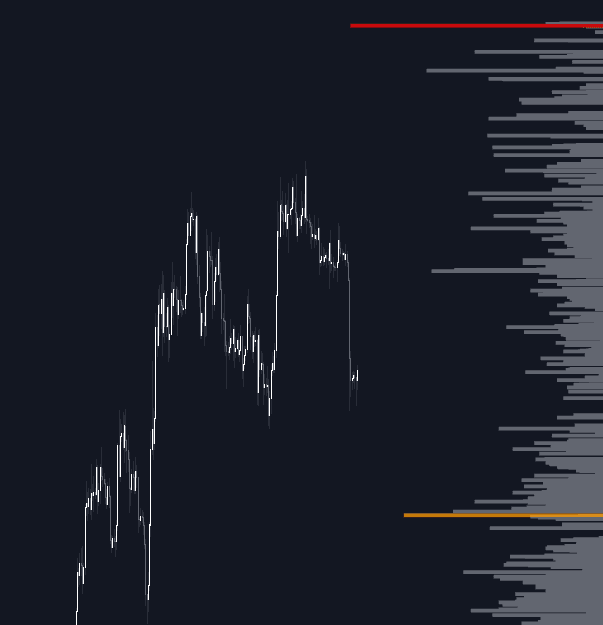
The Volume Profile (Maps) indicator allows traders to identify areas of high trading activity based on frequent closing prices or zones with maximum volume. This feature is especially beneficial for highlighting liquid trading zones. It visually represents these areas by marking them in red and orange, which can serve as vital support and resistance markers.
The absence of volume in certain price levels, manifested as voids, may indicate zones with significant price fluctuations or volatility.
Understanding the Core Concepts
Maps
In the realm of programming, a map object functions as a collection of unique key-value pairs. Each key is singular, and duplicate keys results in updated values for existing entries. Within this script, volume acts as the value associated with each price point serving as a key.
- Volume is linked with a specific price, such as the close price (or optionally the high, low, or open).
- Existing keys within the map receive cumulative volume values as they repeat.
Pine Script's map can store up to 50,000 values, accommodating up to 20,000 bars—sufficient for displaying extended historical data.
Managing Visual Representation Limitations
Only a maximum of 500 lines can be drawn using the line.new() function in TradingView. The script focuses on the most recent close price, illustrating parallel volume values using lines—250 lines above and 250 below the current price level.
Pushing beyond these limits, using boxes via box.new() transitions the visualization while maintaining functionality. Combined, this allows up to 1,000 visual elements.
When confusion arises from overlapping visuals, maintain the 'Amount of bars' to a maximum of 500.
Rounding and Custom Steps
To further customize visualization, two distinct rounding methods can adjust the Volume Profile:
- Round Function
- Setting at zero keeps original numerals.
- Negative settings designate decimal count to round off.
- Positive settings round whole numbers before the decimal.
Example rounding applications for the number 123456.789 include:
0 -> 123456.789 1 -> 123456.79 2 -> 123456.8 3 -> 123457 -1 -> 123460 -2 -> 123500
- Steps Implementation
- "Step" setting introduces regulated price intervals, simplifying the profile appearance.
Examples:
- 2 -> 1234.00, 1236.00, 1238.00
- 5 -> 1230.00, 1235.00, 1240.00
Indicator's Functional Features
Position and Width Adjustments
Detailed Table Overview
This table summarizes key elements:
- Size originalMap: Total elements in the initial map.
- # higher: Counts elements surpassing the last closing price.
- index "close": Marks the last known closing price.
- Size newMap: New map elements for line displays.
Price-Volume Multiplication
In pairings like BTCUSD, associating volume with currency is crucial due to substantial price disparities. Enabling Volume * currency applies price as a multiplier for volume figures.
- At 10 volume:
- 100 USD = 1,000 USD output.
- 30K USD = 300K USD output.
Disabled View:
Enabled View:
Breakdown of Technical Details
Adding to Map
If an unlisted price is introduced, it is appended using map.put(id, key, value).
Example Operations:
map.put(originalMap, price, volume) or originalMap.put(price, volume).
Unique keys require minimal navigation—determine the value by identifying the key through map.get(id, key).
Sorting and Indexing
Upon completing entries, all pricing keys undergo sorting for streamlined presentation.
copyK = originalMap.keys().copy()
copyK.sort()
idx = copyK.binary_search_leftmost(src)
The post-sorted list is organized to show a balanced split of data to both sides of a median closing price.
Creating a New Map
Identified keys are then allocated into a new map, maintaining original map's reference volumes.
Example Initialization: newMap = map.new<float, float>()
Summary Process
- Insert data into the original map where price is the key and volume is the value.
- Copy and organize keys.
- Determine the last price's index.
- Extract significant data left and right of this index.
- Transfer relevant data into a new map with linked volume.
Simple Example with Visualization:
bar 0, price = 2, volume = 23
Final visual elements reflect selected data interpretation.
Configurations and Settings
- Source: Define your source, defaulting to close, opt for high, low, open, etc. as alternatives.
- Volume & currency: Facilitate volume adjustments through pricing (explained in Features).
- Amount of bars: Set the desired volume profile bar count.
- Max lines: Set to a max of 1000 (500 for lines-only preference, avoiding boxes).
Rounding and Step Adjustments
- Refer to Concepts for Round and Step explanations.
Visual Adjustment Options
- Profile offset aligns the volume profile up to 500 bars right of the last bar; detailed in Profile Adjustments.
Recognized Limitations
- Code restricts lines from extending beyond the inaugural bar.
- Volume Profile placement caps at 500 bars right of the last trading price.
- Combined line and box display does not exceed 1,000 elements.
FAQ
-
How do I access the Volume Profile (Maps) indicator? You can get access on the LuxAlgo Library for charting platforms like TradingView, MetaTrader (MT4/MT5), and NinjaTrader for free.
-
What are the key advantages of using the Volume Profile (Maps) indicator? It helps identify high-volume liquidity zones for potential support and resistance, enhancing trade strategy.
Trading & investing are risky and many will lose money in connection with trading and investing activities. All content on this site is not intended to, and should not be, construed as financial advice. Decisions to buy, sell, hold or trade in securities, commodities and other investments involve risk and are best made based on the advice of qualified financial professionals. Past performance does not guarantee future results.
Hypothetical or Simulated performance results have certain limitations. Unlike an actual performance record, simulated results do not represent actual trading. Also, since the trades have not been executed, the results may have under-or-over compensated for the impact, if any, of certain market factors, including, but not limited to, lack of liquidity. Simulated trading programs in general are designed with the benefit of hindsight, and are based on historical information. No representation is being made that any account will or is likely to achieve profit or losses similar to those shown.
Testimonials appearing on this website may not be representative of other clients or customers and is not a guarantee of future performance or success.
As a provider of technical analysis tools and strategies, we do not have access to the personal trading accounts or brokerage statements of our customers. As a result, we have no reason to believe our customers perform better or worse than traders as a whole based on any content, tool, or platform feature we provide.
Charts used on this site are by TradingView in which the majority of our technical indicators are built on. TradingView® is a registered trademark of TradingView, Inc. www.TradingView.comTradingView® has no affiliation with the owner, developer, or provider of the Services described herein.
Market data is provided by CBOE, CME Group, BarChart, CoinAPI. CBOE BZX real-time US equities data is licensed from CBOE and provided through BarChart. Real-time futures data is licensed from CME Group and provided through BarChart. Select cryptocurrency data, including major coins, is provided through CoinAPI. All data is provided “as is” and should be verified independently for trading purposes.
This does not represent our full Disclaimer. Please read our full disclaimer.
© 2026 LuxAlgo Global, LLC.